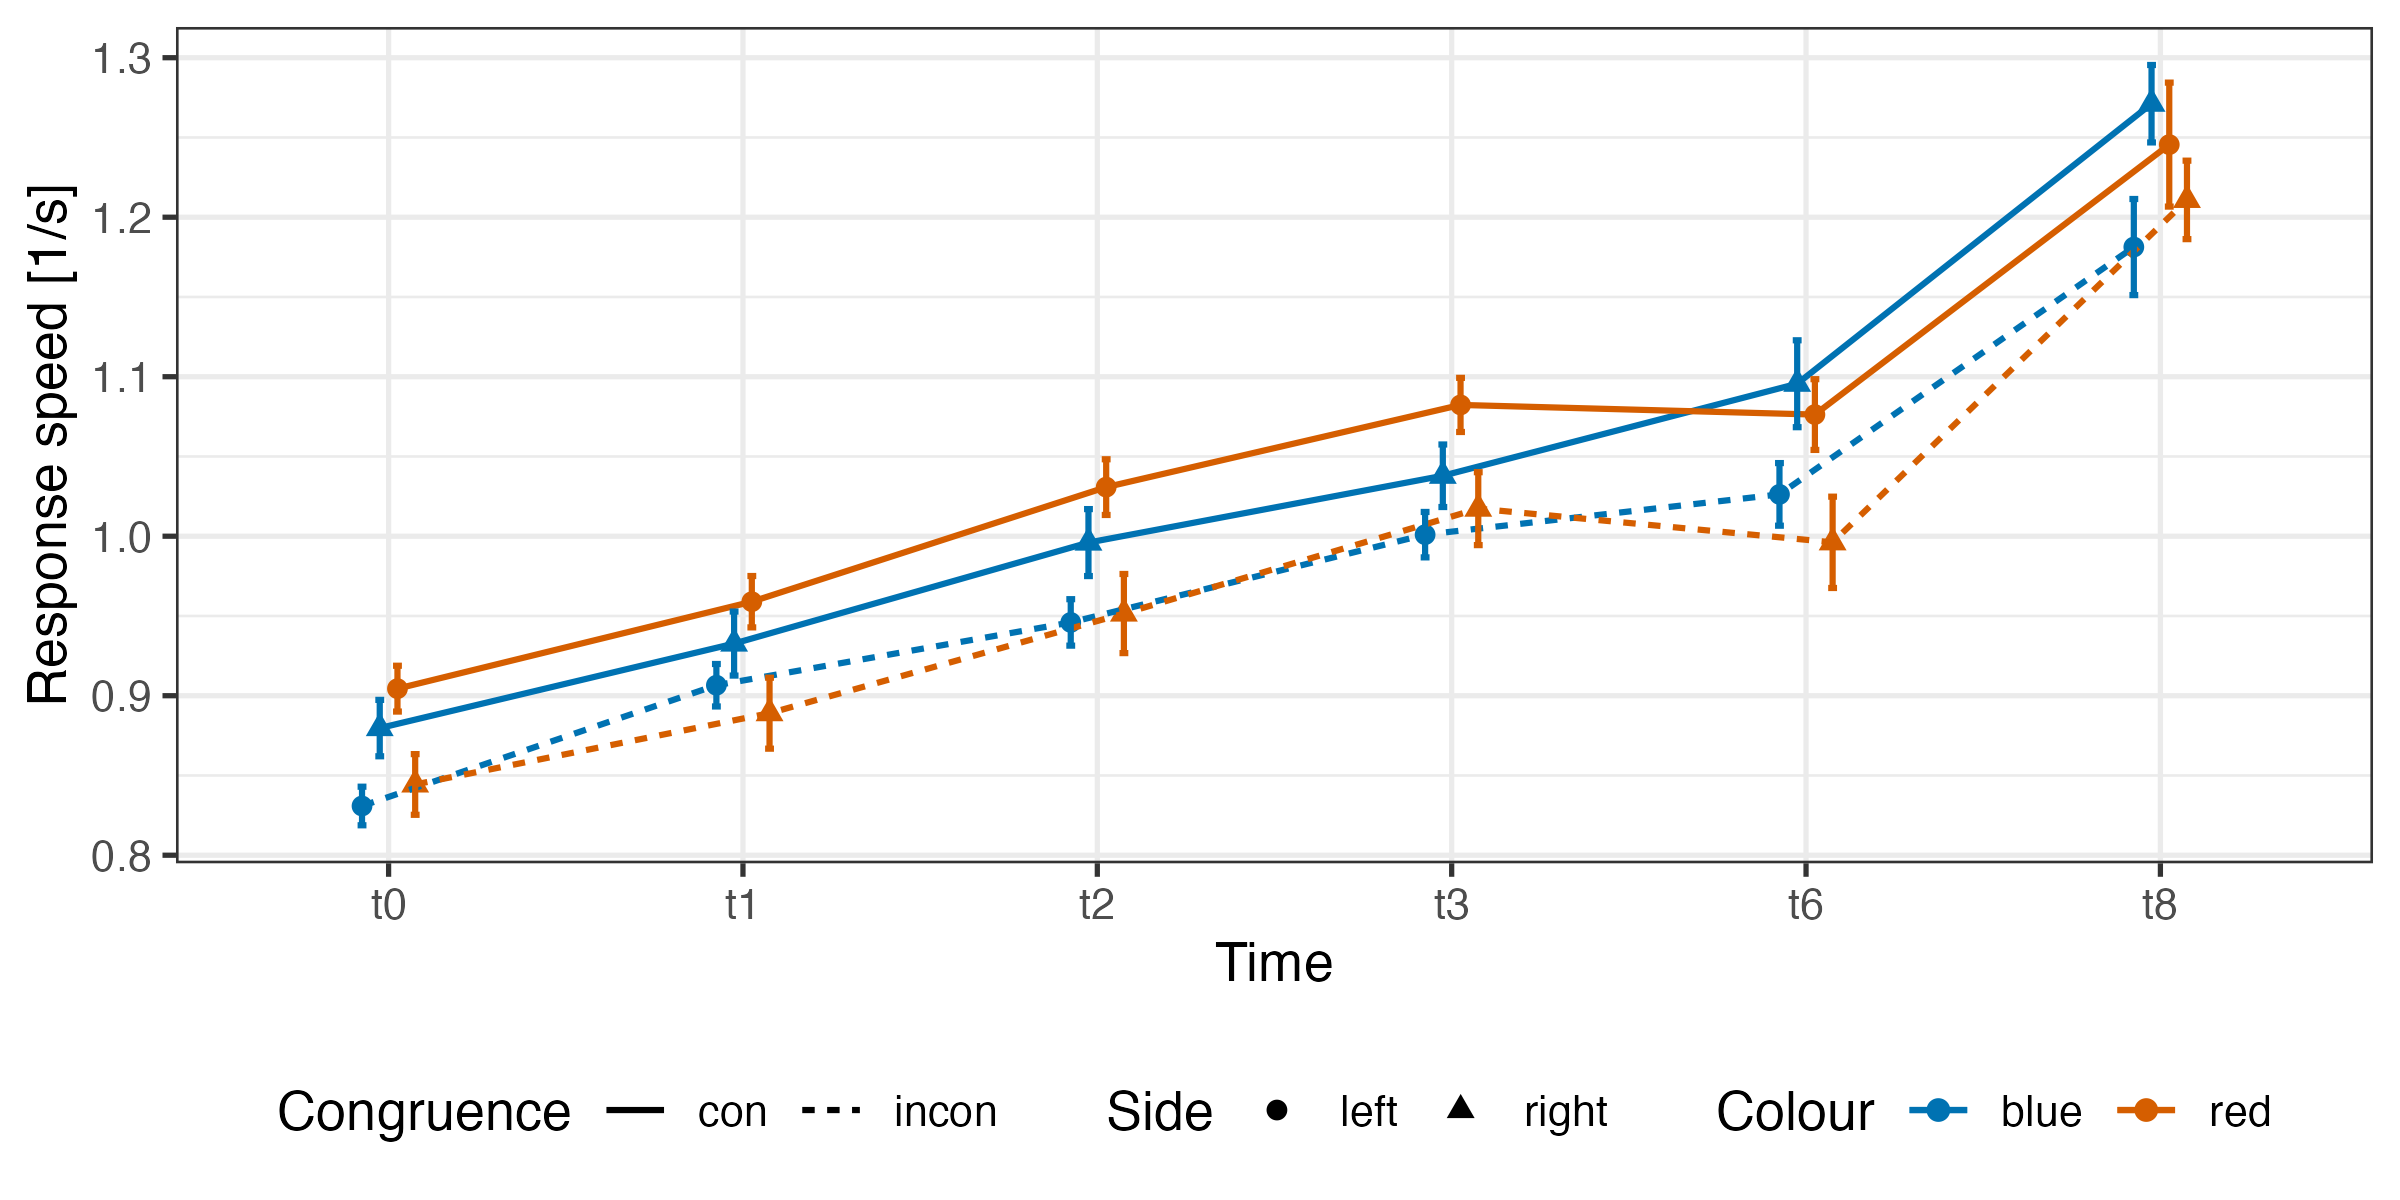
The significant effects for congruence, meaning faster response speeds for congruent compared to incongruent conditions, as well as overall improvements in response speed with age were consistent with current literature on Simon task performances in children (Davidson et al., 2006). A likely cause of congruence effects is the tendency to respond on the same side as the stimulus (Valle-Inclán, 1996), which is the dominant response that must be suppressed or inhibited to correctly identify incongruent stimuli (Bastian et al., 2016; Hilchey & Klein, 2011), causing a delay in response time. The improvement in reaction speed with age could be explained by growth- and maturity-related changes of physiological and psychological conditions that play a role in the Simon task, such as reaction to appearance of the stimulus with subsequent identification or execution of the respective motor response (Chan et al., 1991). Other aspects to consider are cultural and learning aspects associated with the task, such as increasing familiarity with a tablet, as well as learning from repeated test execution (Li et al., 2004).
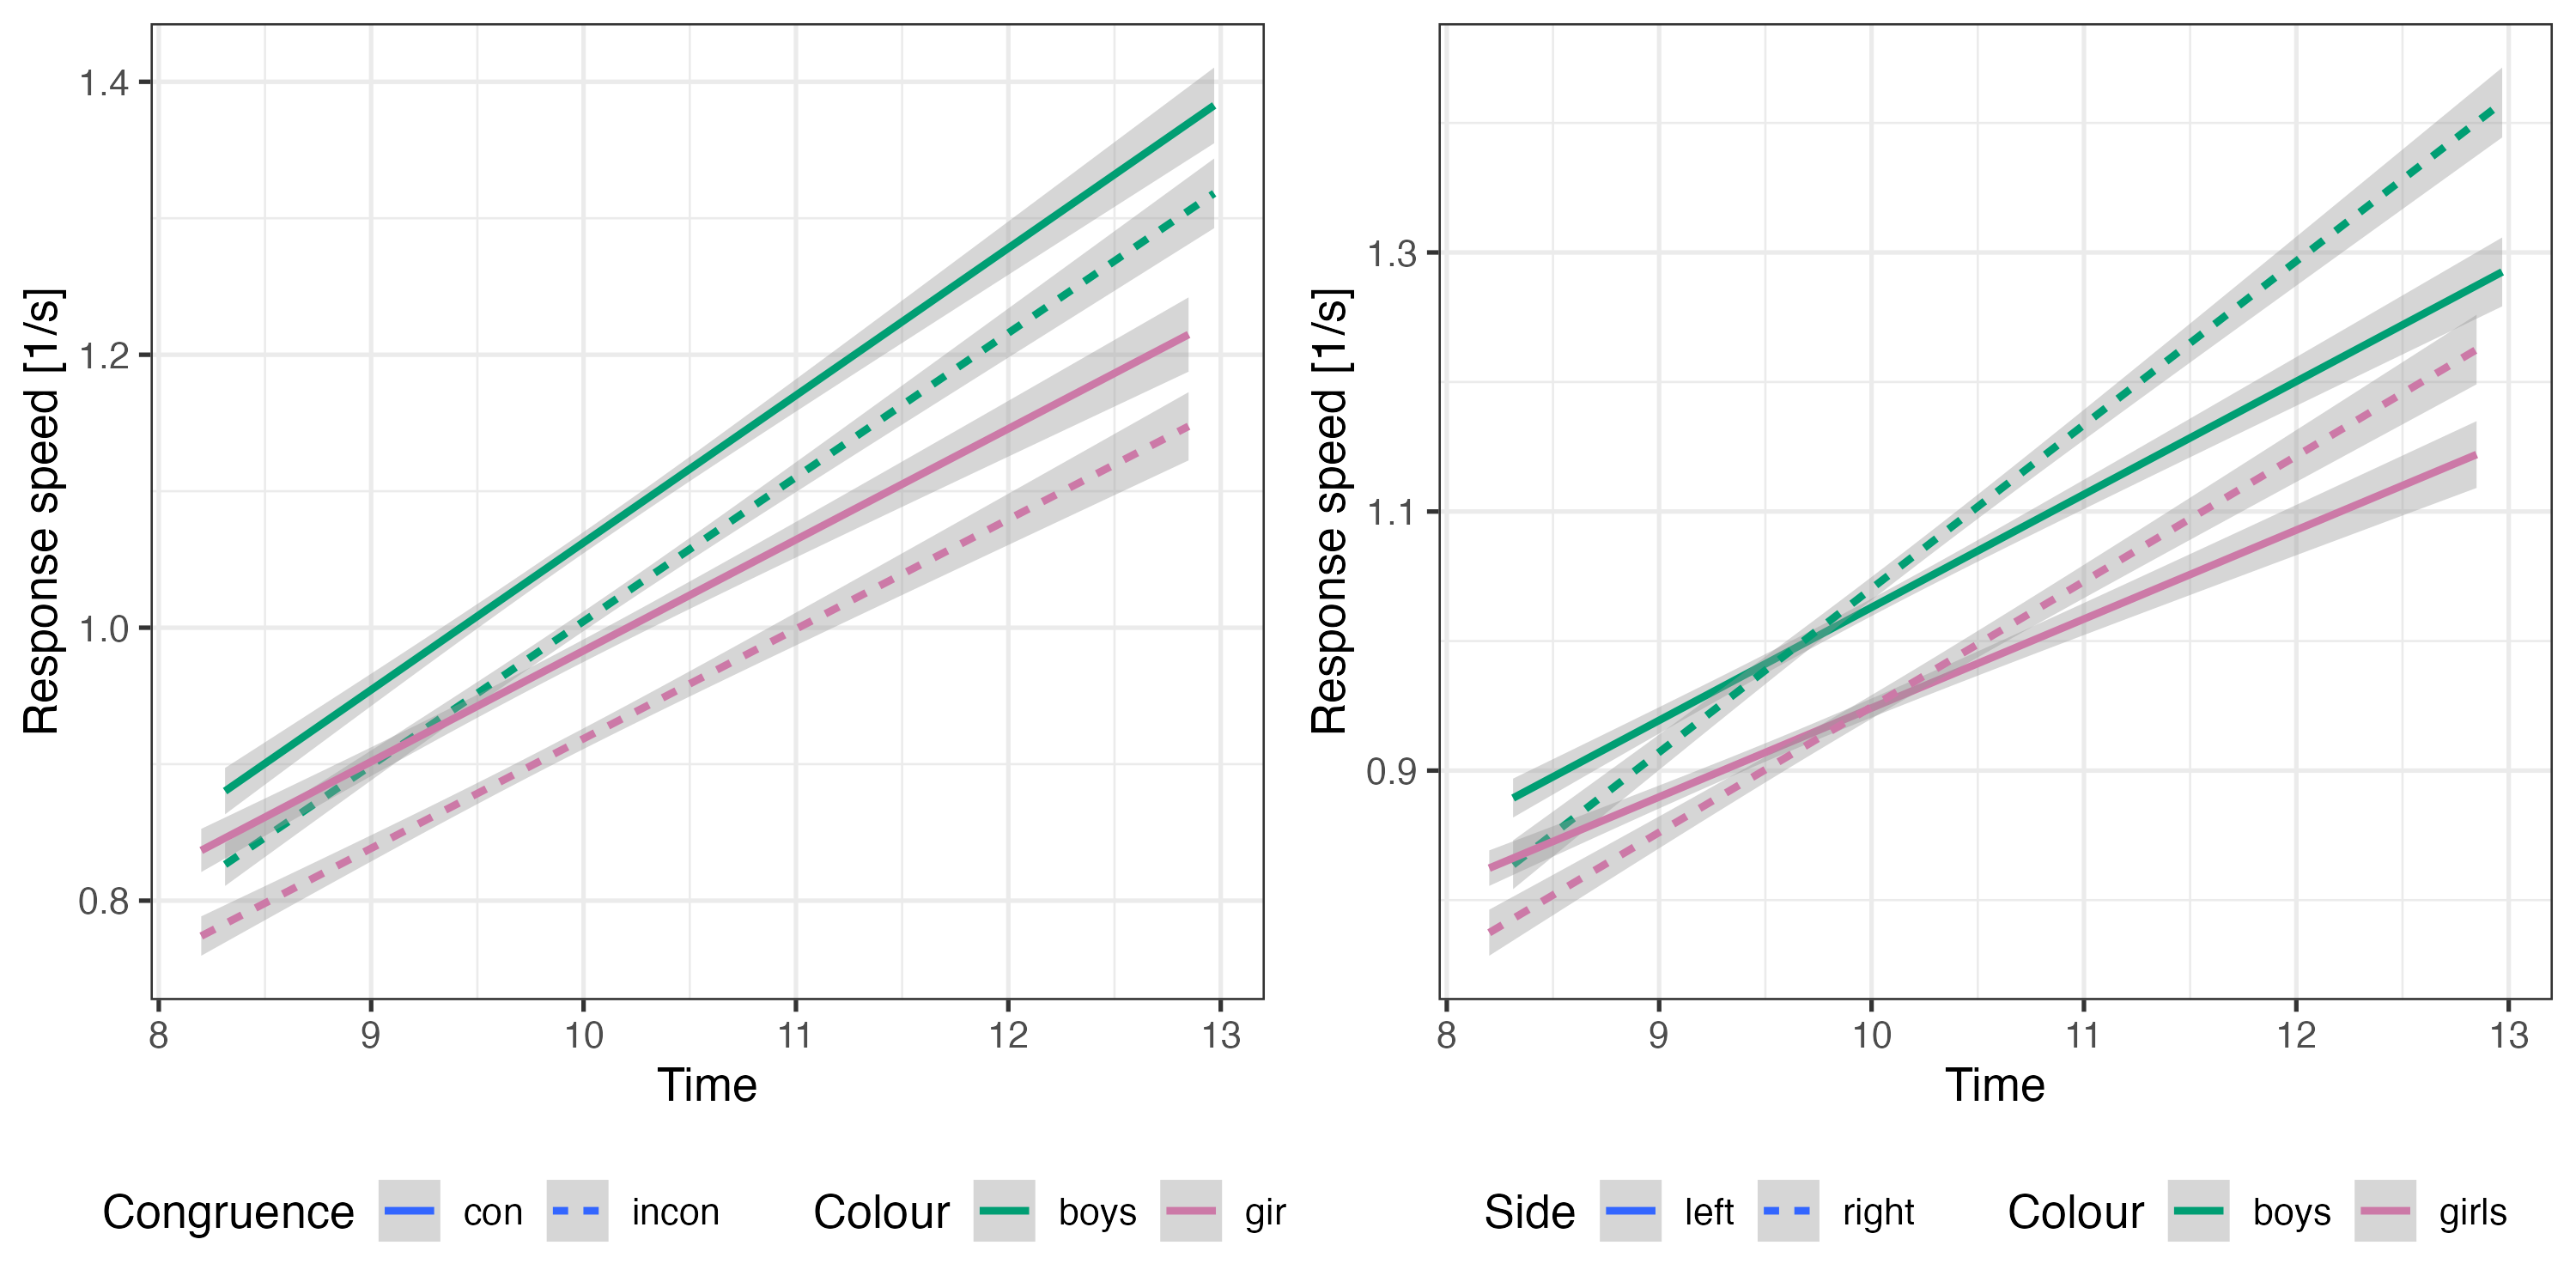
Moreover, the first LMM showed effects for side and gender, with faster reaction times for boys compared to girls and for the left side compared to the right. As mentioned in Section 2.4.3, Simon task conditions were biased towards the left side (i.e., 40 left and 20 right), which may have biased children to pay more attention to the left side and thus achieving faster reaction speeds for stimuli appearing there. Another influence could result from general prevalences of right-handedness (Papadatou-Pastou et al., 2020) (handedness was not assessed in the SMaRTER study), as children may have covered parts of the right side of the screen with their right hand hovering above it in order to react quickly to presented stimuli. This could have shifted their attention more towards the left side. Interestingly, Figure 6.2 and Figure 6.3 show a possible interaction between side/colour and age, with a shift in side/colour occurring between t3 and t6, which frame the onset of the covid pandemic. However, since interactions were not included in the model, these results are not further discussed. In terms of gender, a study examining effects of different conditions of task switching using Simon task variations in 325 children aged 4 to 13 years found no gender differences for any conditions examined (Davidson et al., 2006). One possible reason for gendered differences found in this analysis might be a gendered upbringing where, for example, boys are more fixated on technical toys compared to girls (Todd et al., 2017). However, interpretation of gender differences in cognition must be done with caution, considering that the established field of gender neuroscience seems to be biased by the assumption of a “biological binary gender distribution” (Jordan-Young, 2010) and gender effects (as well as effects for side) did not remain significant when physical fitness components were entered into the model.
In both LMMs, correlations of individual variance components for colour and congruence effects as well as colour and side effects were negative. Since reaction speeds were faster for red as well as congruent stimuli, this correlation suggests that children who have slower reaction speeds in the incongruent condition (compared to the congruent condition) have faster reaction speeds for the blue stimulus (compared to the red stimulus). In other words, children who have greater cognitive flexibility (i.e., lower congruence effects) tend to have faster reaction times to red stimuli (i.e., larger colour effects). Studies have found faster reaction times for red stimuli compared to blue or grey stimuli across a range of cognitive assessments (Elliot, 2019; Elliot & Aarts, 2011), though they appear to vary depending on conditions like difficulty and type of cognitive task in which they were assessed (Elliot, 2019; Xia et al., 2016). Accordingly, since no significant main effect for colour was found in any of the models, this could imply that the colour effect might have been “overshadowed” or “swallowed” by the congruence effect. A similar dynamic could have caused the correlation of the individual variance components colour and side. However, this effect could also have been caused by the already mentioned skewness of the Simon task in favour of left stimuli.
Including 6 min run, star run, and one leg balance in the fixed effects revealed positive effects on reaction speed for star run and one leg balance performances and a negative effect of reaction speed for 6 min run performance. As star run and one leg balance are both tests placed in the coordinative domain of physical fitness, they are expected to involve cognitive aspect which might also have beneficial effects on reaction speed. Thus, the positive effect of star run and one leg balance performances on Simon task reaction speed are consistent with recent findings (Haverkamp et al., 2021; Marchetti et al., 2015; Niet et al., 2014). The negative effect of 6 min run performances on reaction speeds in the Simon task on the other hand were in the opposite direction than expected (Hillman et al., 2009; Kvalø et al., 2019; Niet et al., 2014). However, these fixed effects could not be replicated in a model in which individual variance of these tests was accounted for.
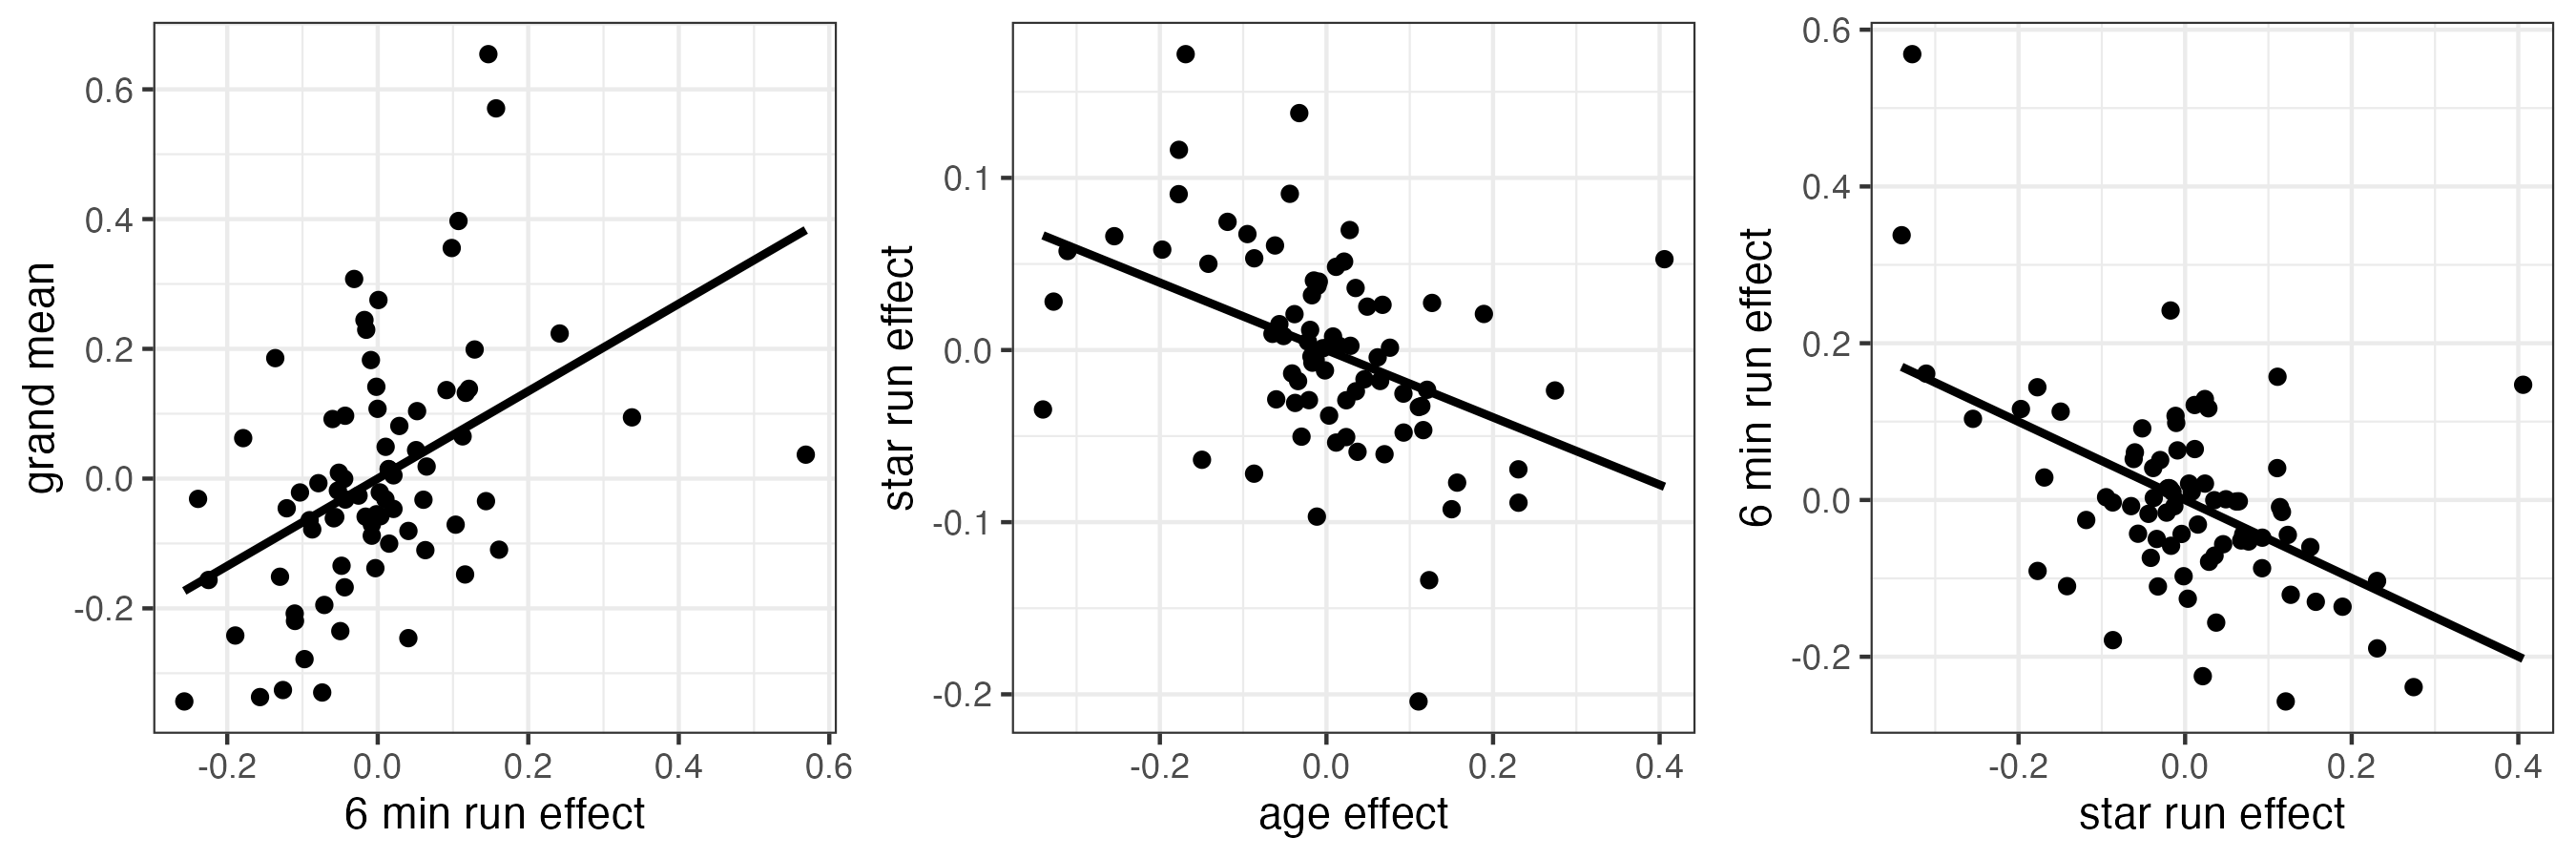
The inclusion of physical fitness tests as individual variance components revealed a positive correlation between overall reaction speed and 6 min run effects, showing that children who elicit greater 6 min run effects also tend to have faster overall reaction speeds. This could be explained by structural changes in the brain induced by higher levels of cardiorespiratory fitness associated with improvements in executive function (Chaddock et al., 2011, 2012; Chaddock-Heyman et al., 2014; Cotman et al., 2007, 2007; Hillman et al., 2008; Tyndall et al., 2018). It is also possible that faster reaction speed signifies enhanced executive functions that are associated with improved pacing, thereby linking better executive functions to improved 6 min run performance (Hyland-Monks et al., 2018). In addition, the direction could be moderated by the social environment, as environments that support physical activity or provide better access to increase cardiorespiratory fitness also provide better access to cognitive engagement (Brockman et al., 2009).
A negative correlation was found between star run and 6 min run effects on reaction speed, which means that children with a larger 6 min run effect are more likely to have a smaller star run effect and vice versa. This might suggest that there are different aspects associated with 6 min run or star run performances that promote executive function but might inhibit each other. Even if a trade-off may be possible between the above-mentioned neurophysiological changes associated with either cardiorespiratory fitness or coordinative aspects that are present in star run but not in 6 min run (such as improved cerebellar activation and excitability (Diedrichsen et al., 2007)), it seems unlikely that these aspects have mutually exclusive structure in their effect on reaction speed. Other possible explanation could therefore be that, on one hand, physiological changes associated with high physical activity and thus better 6 min run have a positive effect on executive functions (Hillman et al., 2005, 2009). While on the other hand, children with low levels of physical activity might be more likely to be invested in sedentary activities such as computer games, which are beneficial for development of executive functions (Nuyens et al., 2019). This is then positively related to faster reaction times in the Simon task as well as improved star run performance, but may show no connection to 6 min run performances or its effect on reaction speed. Another aspect to consider at this point is that the negative correlation between 6 min run and star run effects could be caused by covid pandemic-related changes in daily life, as habitual physical activity likely decreased and screen time increased during the last two assessments (Nagata et al., 2020; Schmidt et al., 2020, 2022). Note that these effects were not examined due to large dropouts in both assessments during the pandemic (see Section 2.6).
Similarly, these interdependencies may also account for the negative correlation between individual variance components found for age and star run effects on reaction speed, meaning that children with greater age-related improvements in reaction speed tend to have a smaller star run-related improvements. It should be noted that both age and star run have a positive effect on individual reaction speed and accordingly influence each other in magnitude rather than direction. Here too, changes in daily life associated with the covid pandemic may have negatively influenced the magnitude of 6 min run effects through reduced physical activity, while increased screen time may have promoted age-related improvements in the Simon task linked to familiarity with computer interfaces, as well as improved executive functions (Kovacs et al., 2022). Considering the impact of lockdown measures in the analysis, inferences should also be made about SARS-CoV-2 infections, especially in light of accumulating evidence linking SARS-CoV-2 infections and post-covid symptoms with cognitive impairments such as cognitive deficits, executive dysfunction, increased risk of seizures, and others (Hall et al., 2022; Taquet et al., 2022; Yea et al., 2023). Although these more severe impairments are comparatively rare in infected children, they suggest that SARS-CoV-2 infections could affect cognitive development in children. The decline in comprehensive testing for SARS-CoV-2 infections (MBJS, 2022a, 2022b) combined with the higher prevalence of asymptomatic infections in children (Ravindra et al., 2022) allows speculation about possible SARS-CoV-2-related cognitive shifts in youth populations. However, these effects are still unclear today and need to be clarified in future research.
Overall, these results underscore the relationship between physical fitness and executive function in children, as well as considerations of individual differences in these relationships. However, since comparable information is scarce, the question arises whether these correlations only exist in children with physical fitness deficits or whether they can be extrapolated to physically fit children. More specifically, how different aspects of physical fitness (e.g., different components and their levels) are related to children’s executive function, and how these relationships are associated with the lived environment and socioeconomic conditions.
Bastian, C. C. von, Souza, A. S., & Gade, M. (2016). No evidence for bilingual cognitive advantages: A test of four hypotheses.
Journal of Experimental Psychology: General,
145, 246–258.
https://doi.org/10.1037/xge0000120
Bates, D. M., Kliegl, R., Vasishth, S., & Baayen, H. (2018). Parsimonious mixed models douglas bates. ArXiv e-Print, Under Revision.
Box, G. E. P., & Cox, D. R. (1964). An analysis of transformations.
Journal of the Royal Statistical Society: Series B (Methodological),
26.
https://doi.org/10.1111/j.2517-6161.1964.tb00553.x
Brockman, R., Jago, R., Fox, K. R., Thompson, J. L., Cartwright, K., & Page, A. S. (2009). "Get off the sofa and go and play": Family and socioeconomic influences on the physical activity of 10 -11 year old children.
BMC Public Health,
9.
https://doi.org/10.1186/1471-2458-9-253
Chaddock, L., Erickson, K. I., Prakash, R. S., Voss, M. W., VanPatter, M., Pontifex, M. B., Hillman, C. H., & Kramer, A. F. (2012). A functional MRI investigation of the association between childhood aerobic fitness and neurocognitive control.
Biological Psychology,
89.
https://doi.org/10.1016/j.biopsycho.2011.10.017
Chaddock, L., Pontifex, M. B., Hillman, C. H., & Kramer, A. F. (2011). A review of the relation of aerobic fitness and physical activity to brain structure and function in children.
Journal of the International Neuropsychological Society.
https://doi.org/10.1017/S1355617711000567
Chaddock-Heyman, L., Erickson, K. I., Holtrop, J. L., Voss, M. W., Pontifex, M. B., Raine, L. B., Hillman, C. H., & Kramer, A. F. (2014). Aerobic fitness is associated with greater white matter integrity in children.
Frontiers in Human Neuroscience,
8.
https://doi.org/10.3389/fnhum.2014.00584
Chan, J. W. C., Eysenck, H. J., & Lynn, R. (1991). Reaction times and intelligence among hong kong children.
Perceptual and Motor Skills,
72.
https://doi.org/10.2466/pms.1991.72.2.427
Cotman, C. W., Berchtold, N. C., & Christie, L. A. (2007). Exercise builds brain health: Key roles of growth factor cascades and inflammation. In
Trends in Neurosciences (Vol. 30).
https://doi.org/10.1016/j.tins.2007.06.011
Davidson, M. C., Amso, D., Anderson, L. C., & Diamond, A. (2006). Development of cognitive control and executive functions from 4 to 13 years: Evidence from manipulations of memory, inhibition, and task switching.
Neuropsychologia,
44, 2037–2078.
https://doi.org/10.1016/j.neuropsychologia.2006.02.006
Diedrichsen, J., Criscimagna-Hemminger, S. E., & Shadmehr, R. (2007). Dissociating timing and coordination as functions of the cerebellum.
Journal of Neuroscience,
27.
https://doi.org/10.1523/JNEUROSCI.0061-07.2007
Elliot, A. J. (2019). A historically based review of empirical work on color and psychological functioning: Content, methods, and recommendations for future research.
Review of General Psychology,
23.
https://doi.org/10.1037/gpr0000170
Elliot, A. J., & Aarts, H. (2011). Perception of the color red enhances the force and velocity of motor output.
Emotion,
11.
https://doi.org/10.1037/a0022599
Hall, P. A., Meng, G., Hudson, A., Sakib, M. N., Hitchman, S. C., MacKillop, J., Bickel, W. K., & Fong, G. T. (2022). Cognitive function following SARS-CoV-2 infection in a population-representative canadian sample.
Brain, Behavior, and Immunity - Health,
21.
https://doi.org/10.1016/j.bbih.2022.100454
Haverkamp, B. F., Oosterlaan, J., Königs, M., & Hartman, E. (2021). Physical fitness, cognitive functioning and academic achievement in healthy adolescents.
Psychology of Sport and Exercise,
57.
https://doi.org/10.1016/j.psychsport.2021.102060
Hilchey, M. D., & Klein, R. M. (2011). Are there bilingual advantages on nonlinguistic interference tasks? Implications for the plasticity of executive control processes. In
Psychonomic Bulletin and Review (Vol. 18).
https://doi.org/10.3758/s13423-011-0116-7
Hillman, C. H., Buck, S. M., Themanson, J. R., Pontifex, M. B., & Castelli, D. M. (2009). Aerobic fitness and cognitive development: Event-related brain potential and task performance indices of executive control in preadolescent children.
Developmental Psychology,
45.
https://doi.org/10.1037/a0014437
Hillman, C. H., Castelli, D. M., & Buck, S. M. (2005). Aerobic fitness and neurocognitive function in healthy preadolescent children.
Medicine and Science in Sports and Exercise,
37.
https://doi.org/10.1249/01.mss.0000176680.79702.ce
Hillman, C. H., Erickson, K. I., & Kramer, A. F. (2008). Be smart, exercise your heart: Exercise effects on brain and cognition. In
Nature Reviews Neuroscience (Vol. 9).
https://doi.org/10.1038/nrn2298
Hyland-Monks, R., Cronin, L., McNaughton, L., & Marchant, D. (2018). The role of executive function in the self-regulation of endurance performance: A critical review. In
Progress in Brain Research (Vol. 240).
https://doi.org/10.1016/bs.pbr.2018.09.011
Jordan-Young, R. M. (2010). Brainstorm - the flaws in the science of sex differences. Harvard University Press.
Kovacs, V. A., Starc, G., Brandes, M., Kaj, M., Blagus, R., Leskošek, B., Suesse, T., Dinya, E., Guinhouya, B. C., Zito, V., Rocha, P. M., Gonzalez, B. P., Kontsevaya, A., Brzezinski, M., Bidiugan, R., Kiraly, A., Csányi, T., & Okely, A. D. (2022). Physical activity, screen time and the COVID-19 school closures in europe–an observational study in 10 countries.
European Journal of Sport Science,
22.
https://doi.org/10.1080/17461391.2021.1897166
Kvalø, S. E., Dyrstad, S. M., Bru, E., & BrØnnick, K. (2019). Relationship between aerobic fitness and academic performance: The mediational role of executive function.
Journal of Sports Medicine and Physical Fitness,
59.
https://doi.org/10.23736/S0022-4707.18.08971-5
Li, S. C., Lindenberger, U., Hommel, B., Aschersleben, G., Prinz, W., & Baltes, P. B. (2004). Transformations in the couplings among intellectual abilities and constituent cognitive processes across the life span.
Psychological Science.
https://doi.org/10.1111/j.0956-7976.2004.01503003.x
Marchetti, R., Forte, R., Borzacchini, M., Vazou, S., Tomporowski, P. D., & Pesce, C. (2015). Physical and motor fitness, sport skills and executive function in adolescents: A moderated prediction model.
Psychology,
06.
https://doi.org/10.4236/psych.2015.614189
MBJS. (2022a). 30. Sitzung des ausschusses für bildung, jugend und sport am 5. Mai 2022 bericht des ministeriums für bildung, jugend und sport zum aktuellen sachstand bei den getroffenen maßnahmen zur eindämmung des coronavirus, insbesondere in den bereichen schule und kindertagesstätte, sowie zum aktuellen sachstand bei der umsetzung des digitalpakts schule. Ministerium für Bildung, Jugend und Sport - Brandenburg.
MBJS. (2022b). 31. Sitzung des ausschusses für bildung, jugend und sport am 9. Juni 2022 bericht des ministeriums für bildung, jugend und sport zum aktuellen sachstand bei den getroffenen maßnahmen zur eindämmung des coronavirus, insbesondere in den bereichen schule und kindertagesstätte, sowie zum aktuellen sachstand bei der umsetzung des digitalpakts schule. Ministerium für Bildung, Jugend und Sport - Brandenburg.
Nagata, J. M., Magid, H. S. A., & Gabriel, K. P. (2020). Screen time for children and adolescents during the coronavirus disease 2019 pandemic.
Obesity,
28.
https://doi.org/10.1002/oby.22917
Niet, A. G. van der, Hartman, E., Smith, J., & Visscher, C. (2014). Modeling relationships between physical fitness, executive functioning, and academic achievement in primary school children.
Psychology of Sport and Exercise,
15.
https://doi.org/10.1016/j.psychsport.2014.02.010
Nuyens, F. M., Kuss, D. J., Lopez-Fernandez, O., & Griffiths, M. D. (2019). The empirical analysis of non-problematic video gaming and cognitive skills: A systematic review. In
International Journal of Mental Health and Addiction (Vol. 17).
https://doi.org/10.1007/s11469-018-9946-0
Papadatou-Pastou, M., Ntolka, E., Schmitz, J., Martin, M., Munafò, M. R., Ocklenburg, S., & Paracchini, S. (2020). Human handedness: A meta-analysis.
Psychological Bulletin,
146.
https://doi.org/10.1037/bul0000229
Ravindra, K., Malik, V. S., Padhi, B. K., Goel, S., & Gupta, M. (2022). Asymptomatic infection and transmission of COVID-19 among clusters: Systematic review and meta-analysis. In
Public Health (Vol. 203).
https://doi.org/10.1016/j.puhe.2021.12.003
Schmidt, S. C. E., Anedda, B., Burchartz, A., Eichsteller, A., Kolb, S., Nigg, C., Niessner, C., Oriwol, D., Worth, A., & Woll, A. (2020). Physical activity and screen time of children and adolescents before and during the COVID-19 lockdown in germany: A natural experiment.
Scientific Reports,
10.
https://doi.org/10.1038/s41598-020-78438-4
Schmidt, S. C. E., Burchartz, A., Kolb, S., Niessner, C., Oriwol, D., & Woll, A. (2022). Influence of socioeconomic variables on physical activity and screen time of children and adolescents during the COVID‑19 lockdown in germany: The MoMo study.
German Journal of Exercise and Sport Research,
52, 362–373.
https://doi.org/10.1007/s12662-021-00783-x
Taquet, M., Sillett, R., Zhu, L., Mendel, J., Camplisson, I., Dercon, Q., & Harrison, P. J. (2022). Neurological and psychiatric risk trajectories after SARS-CoV-2 infection: An analysis of 2-year retrospective cohort studies including 1 284 437 patients. Lancet Psychiatry, 9, 815–827.
Todd, B. K., Barry, J. A., & Thommessen, S. A. O. (2017). Preferences for
“gender-typed” toys in boys and girls aged 9 to 32 months.
Infant and Child Development,
26.
https://doi.org/10.1002/icd.1986
Tyndall, A. V., Clark, C. M., Anderson, T. J., Hogan, D. B., Hill, M. D., Longman, R. S., & Poulin, M. J. (2018). Protective effects of exercise on cognition and brain health in older adults.
Exercise and Sport Sciences Reviews,
46.
https://doi.org/10.1249/JES.0000000000000161
Valle-Inclán, F. (1996). The locus of interference in the simon effect: An ERP study.
Biological Psychology,
43.
https://doi.org/10.1016/0301-0511(95)05181-3
Xia, T., Song, L., Wang, T. T., Tan, L., & Mo, L. (2016). Exploring the effect of red and blue on cognitive task performances.
Frontiers in Psychology,
7.
https://doi.org/10.3389/fpsyg.2016.00784
Yea, C., Barton, M., Bitnun, A., Morris, S. K., Tal, T. E., Ulloa-Gutierrez, R., Brenes-Chacon, H., Yock-Corrales, A., Ivankovich-Escoto, G., Soriano-Fallas, A., Mezerville, M. H., Gill, P., Nateghian, A., Aski, B. H., Manafi, A. A., Dwilow, R., Bullard, J., Papenburg, J., Scuccimarri, R., … Yeh, E. A. (2023). Neurological involvement in hospitalized children with SARS-CoV-2 infection: A multinational study.
Canadian Journal of Neurological Sciences.
https://doi.org/10.1017/cjn.2022.347