2  Study design and methodology

This chapter provides information on the study design and methodology as well as selected group and participant characteristics.

Code
# Chapter R preparations
# libraries
suppressWarnings(suppressMessages(library(tidyverse)))
suppressWarnings(suppressMessages(library(ggplot2)))
suppressWarnings(suppressMessages(library(lme4)))
suppressWarnings(suppressMessages(library(magrittr)))
suppressWarnings(suppressMessages(library(sjPlot)))
suppressWarnings(suppressMessages(library(flextable)))
suppressWarnings(suppressMessages(library(gt)))


#data load
load("data/info.rda")
load("data/ages.rda")
load("data/anthro.rda")
load("data/emo.rda")
load("data/cog.rda")
cbPalette <- c( "#0072B2", "#D55E00", "#009E73", "#CC79A7",
                "#F0E442", "#56B4E9", "#999999", "#E69F00")

#functions
md_compute_gini <- function(welfare, weight) {
  # Compute weighted welfare
  weighted_welfare <- welfare * weight
  weighted_welfare_lag <- collapse::flag(weighted_welfare, fill = 0)
  # Compute area under the curve using
  # Area of trapezoid = Base * Average height
  v <- (cumsum(weighted_welfare_lag) + (weighted_welfare / 2)) * weight
  auc <- sum(v) # Area Under the Curve
  # Compute Area Under the Lorenz Curve
  # Normalize auc so it is always between 0 and 0.5
  auc <- (auc / sum(weight)) / sum(weighted_welfare)
  # Compute Gini
  Gini <- 1 - (2 * auc)
  return(Gini)
}

tab_to_flex <- function(tab,x){
tab2 <- tab |> 
  sjtable2df::mtab2df(n_models = 1) |> 
  mutate(p=ifelse(p==Estimates,"",p))
b <- unlist(suppressWarnings(tab2 |> select(p) |> mutate(p = ifelse(p=="<0.001",1,ifelse(as.numeric(p)<0.05,1,0)))))
r <- tab2[1,which(tab2$Predictors=="Random Effects")]
l <- length(b)
flex <- tab2 |> 
  rename(Est.="Estimates",
         SE="std. Error",
         z="Statistic") |> 
  flextable() |> 
  autofit() |> 
  bold(j=5,i=which(b==1))|> 
  bold(j=1,i=r) |> 
  add_footer_row(values = paste0(x,"Est. = estimate; SE = standar error"), colwidths  = 5) |> 
  hline(i = r-1, part = "body") |> 
  width(j=1,width = 4) |> 
  width(j=2:5, width = .5) |>
  fontsize(size=10, part = "all") 
return(flex)
}

2.1 Main focus of the SMaRTER study

The framework for the implementation of remedial physical education was provided by the resolution of the German Conference of Ministers of Education and Cultural Affairs on principles for the implementation of remedial physical education and for the qualification of remedial physical education teachers. According to these principles, remedial physical education should (1) focus on pupils with motor and psychosocial deficits, (2) be taught by specially trained physical education teachers, (3) aim to restore the physical performance of participating children to a level comparable to that of their peers, (4) include children following specific pedagogical criteria for sports development, (5) aim to increase overall academic learning and performance, and (6) facilitate integration of students into school life (KMK, 1999). In line with these principles, the University of Potsdam, in cooperation with the Ministry of Education, Youth and Sports of the federal state of Brandenburg and the AOK Nordost, conducted the SMaRTER Study (“Überprüfung der Effekte von Sportförderunterricht auf die motorische und kognitive Entwicklung von Grundschulkindern im Land Brandenburg”). The aim of this study was twofold:

  1. Development of a curriculum for remedial physical education for primary school children in the federal state of Brandenburg according to training science principles with a focus on third and fourth grade children with deficits in physical fitness.

  2. Analysis of the short-, mid-, and long-term intervention effects of a remedial physical education intervention in third grade children with deficits in their physical fitness.

2.2 SMaRTER study design

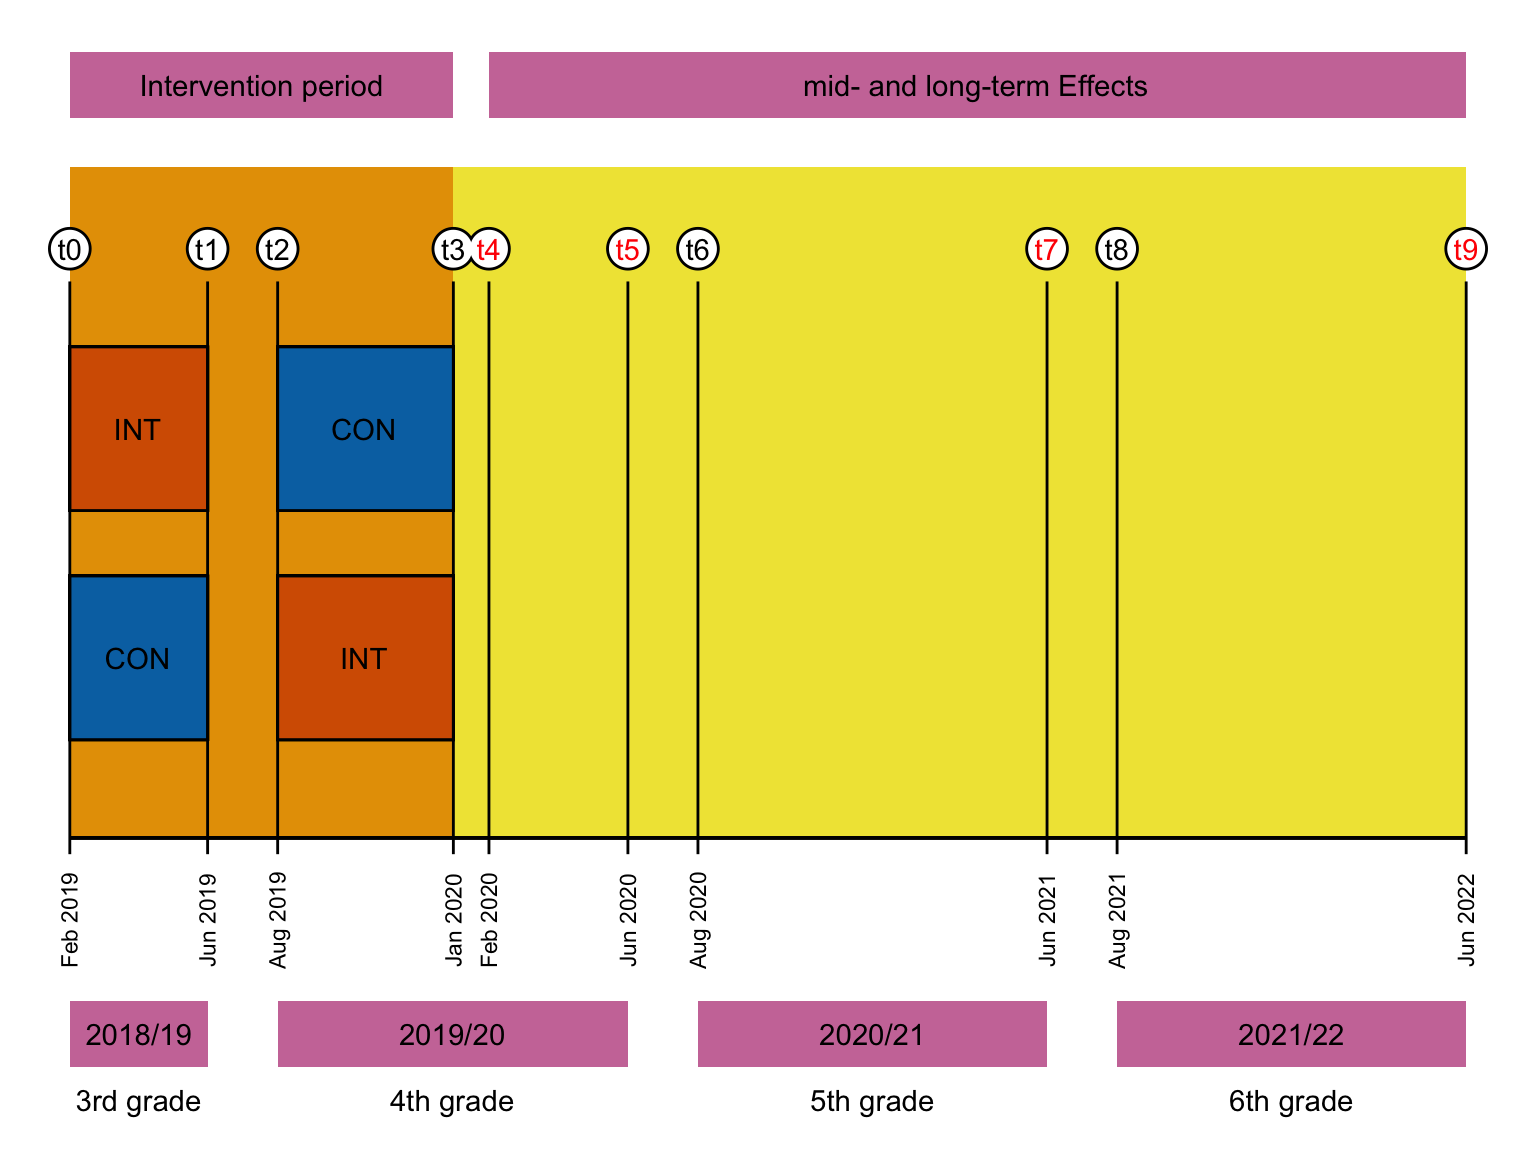
The remedial physical education intervention of the SMaRTER study started in the second semester of third grade of the 2018/19 school year and was conducted using a cluster-randomised controlled design. Accordingly, participating schools were randomly assigned either the intervention first and then control condition (i.e., INT-CON) or the control condition first and then intervention (i.e., CON-INT). During both intervention periods, the assessments were administered before and after each intervention/control, that is, at the beginning and end of the second semester of grade three (i.e., t0: February 2019 & t1: June 2019) and at the beginning and end of the first semester of grade four (i.e., t2: August 2019 & t3: January 2020). Due to primary schools encompassing grades 1 to 6 in the state of Brandenburg, mid- and long-term intervention effects were examined at the beginning and end of the second semester of fourth grade (i.e., t4: February 2020 & t5: June 2020) and at the beginning and end of fifth grade (i.e., t6: August 2020 & t7: June 2021) and sixth grade (i.e., t8: August 2021 & t9: June 2022). The study design is shown in Figure 2.1.

Figure 2.1: SMaRTER study design; INT = intervention; CON = control

Due to the Covid 19 pandemic, however, the originally planned measurements of the mid- and long-term effects could not be realised. Measures to reduce infections (e.g., school closures, classes with/without restricted attendance and regulation of external visitors to the school, see Section 1.5) did not allow assessments t4, t5, and t7 (indicated in red in Figure 2.1). The examinations during the Covid 19 pandemic were carried out in direct consultation with the Ministry of Education, Youth and Sports Brandenburg, taking into account the additional workload of the teachers and schools involved and in compliance with all regulations of the SARS-CoV-2 Containment Regulations at the respective time of examination (e.g., rigorous SARS-CoV-2-testing of assessors, 2 m distance, and obligation to wear a mask). Furthermore, due to the changed framework conditions, a renewed consent of the legal guardians was obtained.

2.2.1 Remedial physical education intervention

The developed and implemented remedial physical education intervention can be found elsewhere1. It included a comprehensive set of exercises to improve physical fitness during a 14-week period with 45 minutes of remedial physical education twice a week. Each session included a warm-up, a main part and a cool-down with different emphases. In each session, all exercises were selected and organised with the main objective of promoting physical activity and fitness, embedded in a comprehensive pedagogical context that focused on interactions between children and reflection on their actions and accomplishments. In addition, each session was supplemented by homework assignments created in cooperation with “Henrietta’s Moving School”2 program of the AOK Nordost. Homework included exercises covering coordination, muscular strength, and muscular endurance. Table 2.1 shows the focus of the 2 x 45 minutes of remedial physical education per week as well as supplementary homework assignments3. All sessions were conducted by certified remedial physical education teachers (MBJS, 2011).

Table 2.1: Remedial physical education intervention curriculum
week focus homework
1 getting to know each other through group games dancing hands (coordination) & clapping with push-ups (strength)
2 perception of space and reaction to acoustic signals laying 8 (coordination) & one-leg stand (coordination)
3 balance exercises tightrope walk backwards (coordination) & tightrope walk with raised knees (coordination)
4 fitness exercises planche (strength) & lunges (strength)
5 running, jumping, and throwing exercises mountain climbing (endurance) & ball throwing (coordination)
6 running, jumping, and throwing exercises rope skipping (coordination) & side planche (coordination)
7 individual and partner coordination exercises four-field jumping (coordination) & alternating jumps (coordination)
8 creative rhythm exercises one-leg stand (coordination) & clapping solo (coordination)
9 ball games ball transport (coordination) & ball transport on the back (coordination)
10 fitness exercises side crunches (strength) & squats (strength)
11 wrestling & brawling exercises boxing (endurance) & random previous homework exercise
12 fitness exercises earlobes (coordination) & jumping jacks (endurance)
13 exercises games mountain jumping (endurance) & bending and stretching (strength)
14 fitness exercises squat jumps (strength) & least successful previous homework exercise

2.3 Inclusion criteria

Following the principles for remedial physical education (KMK, 1999), only schools that employ certified remedial physical education teachers could be included4 (MBJS, 2011). These schools were screened for children with deficits in their physical fitness to include in the study. A physical fitness deficit was identified using data from the EMOTIKON study5 collected in the 2018/19 school year.

Using the six physical fitness tests from the EMOTIKON study, a physical fitness deficit was defined as:

  1. Performance in the first performance quintile (lowest 20%) in four of the six tests; or
  2. a quintile average across the performance quintiles of all six tests of ≤ 1.5 (lowest 30%).

If the data for the children was incomplete or unavailable, their teachers were consulted and a mutual decision on inclusion into the study was made. In addition to the inclusion of children with physical fitness deficits and in accordance with the principles for curative physical education (KMK, 1999), schools were given the opportunity to include children with psychosocial deficits or overweight. Children with severe physical and psychosocial disorders (e.g., physical disability, autism spectrum, bipolar disorder) were not included in the study, but were welcome to participate in remedial physical education intervention. Random allocation into INT-CON and CON-INT conditions occurred at school level (i.e., cluster randomisation) and was concealed. Participating children and remedial physical education teachers were aware of their assignment to the INT-CON and CON-INT condition due to the nature of the intervention. Assessors were aware which schools were assigned to the INT-CON and CON-INT conditions due to the design and organisation of the SMaRTER study. Written consent to participate in the SMaRTER study was obtained twice from the children’s legal guardians6, in accordance with the current Declaration of Helsinki.

2.4 Included assessments

Data on anthropometric measures, physical fitness, executive function, physical activity, and socioemotional well-being were collected at each assessment. The socioeconomic data of the children’s guardians were only measured at the first and last (i.e., t0 and t9) assessments.

2.4.1 Anthropometric measures

Anthropometric measurements included standing and sitting height as well as body composition parameters. Standing and sitting height were measured with a stadiometer (seca 213, seca Gmbh, Hamburg, Germany) according to a standardised protocol. Body mass and body composition parameters (e.g., body fat percentage, muscle mass, and lean mass) were determined using a bioimpedance analysis system (InBody 720, BioSpace, Seoul, Korea). Based on these assessments and the age of the participants, the maturity offset according to Mirwald et al. (2002) and Moore et al. (2015) as well as the body mass index (BMI) were calculated. Formulas are provided in the Appendix (see Appendix Section 8.1.2 and Section 8.1.3).

2.4.2 Physical fitness

Physical fitness was assessed with the EMOTIKON test battery consisting of standing long jump, 20 m sprint, 6 min run, star run, ball push test, and one leg balance. In addition, hand grip strength as well as balance and gait parameters were tested in combination with a dual task.

2.4.2.1 EMOTIKON test

Standing long jump

Standing long jump was conducted to assess the muscular power of the lower limbs. Children had to jump as far as possible from the frontal stance and land with both feet together without any steps or arms touching the ground. Arm swings were allowed. The performance was scored using a tape measure as the distance in meters to the nearest centimeter. Two trials were performed, of which the better one was included in the analysis (Fühner et al., 2021, 2022; Golle, 2015; Golle et al., 2015). The standing long jump shows reliable intraclass correlation coefficients in children aged 5-12 years (ICC = .88 [95% CI .84 - .91] to .94 [95% CI .93 - .95]) (Fernandez-Santos et al., 2015; Fjørtoft et al., 2011) and is strongly associated with other jump tests such as the squat jump, the countermovement jump, and the Abalakov jump test (r = .73 - .78) (Fernandez-Santos et al., 2015).

20 m sprint

To assess linear sprint speed, a 20 m sprint was performed. The children had to sprint a distance of 20 m as fast as possible from an upright position in response to an acoustic signal. The performance was assessed as time to completion, accurate to 1/10 of a second, and was measured with a stopwatch. The best time from two trials was used in this analysis (Fühner et al., 2021, 2022; Golle, 2015). Test-retest analyses show high reliability for the 20m sprint in children aged 6 - 18 years (r = .71 - .9) (Bös et al., 2009; Fjørtoft et al., 2011).

6 min run

A 6 min run was performed to assess cardiorespiratory fitness. The test was conducted on a 54 m track (around a volleyball court: 18 m * 9 m) and children had to run as far as possible at a self-determined speed within 6 minutes. Performance was assessed as the maximum distance covered to the nearest 9 m (Fühner et al., 2021, 2022; Golle, 2015). This test shows high test-retest reliability in children aged 5 to 18 years (r = .72 - . 92) (Bös et al., 2009; Fjørtoft et al., 2011; Lawrenz & Stemper, 2012) and correlates moderately with other established proxies of cardiorespiratory fitness such as VO2max7 (r = .46 - .69) and the shuttle run8 (r = .74 - .83) (Faude et al., 2004; Haaren et al., 2011; Lawrenz & Stemper, 2012).

Star run

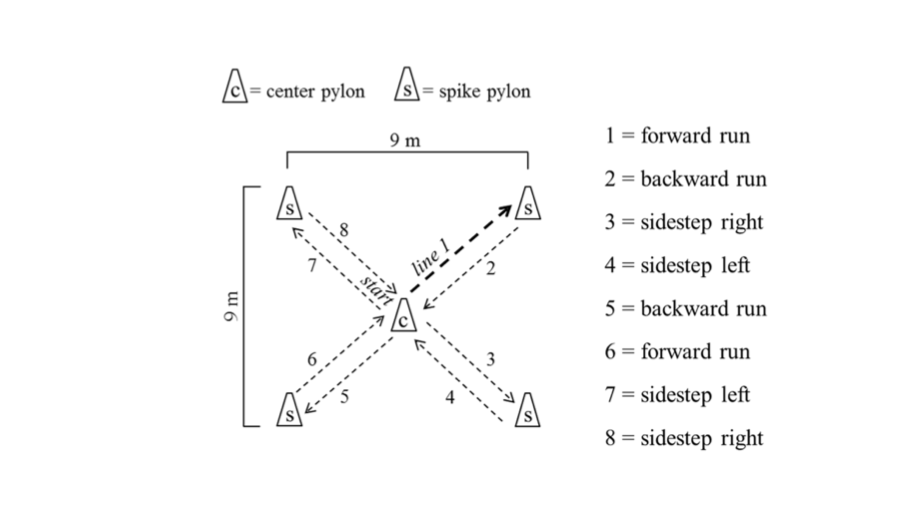
The star run assessed children’s coordination under time pressure. In this test, children had to run from a central position in a star-shaped area on a 9 x 9 m field, using different running styles (i.e., forward, backward, and lateral steps) according to a given protocol (see Figure 2.2). The center and the different spikes of the star were marked by pylons which had to be touched with the hand. The total distance to be covered was 50.912 m and had to be completed as quickly as possible. The performance was evaluated as the fastest time to the nearest 1/10 s from two test trials (Fühner et al., 2021, 2022; Golle, 2015; Golle et al., 2015). The star run is reliable (test-retest) in children aged 8 - 10 years (ICC = .68 [95% CI .53 - .79]) (Schulz, 2013).

Figure 2.2: Star run set up and protocol (adapted from Golle, 2015, p. 61)

Ball push test

A ball push test was performed to assess the muscular power of the upper limbs. Children had to push a 1 kg medicine ball in front of their chest with both hands from a standing position as far as possible. The performance was evaluated as the best of two maximum ball-pushing distances to the nearest ten centimeters (Fühner et al., 2021, 2022; Golle, 2015). Test-retest analysis showed the ball push test to be reliable in children aged 8 to 10 years (ICC = .81 [95% CI .71 - .87]) (Schulz, 2013).

One leg balance

The one leg balance test assessed static balance. Children were instructed to stand on their preferred leg for 60 seconds with their hands on their hips, eyes closed, and the other leg lifted forward at a hip angle of 60-90°. This position had to be held after an acoustic signal without releasing the hands from the hips, touching the lifted leg with the supporting leg or the floor, or bouncing/tapping the supporting leg. Performance was assessed by the time spent in the position to the nearest 1/10th of a second. If the child achieved a time < 5 seconds, a second attempt was allowed (Bormann, 2016; Granacher & Golle, 2016). Test-retest analyses showed that this test is reliable in children aged 7 - 10 years (ICC = .69 [95% CI .61 - .75]) (Bormann, 2016).

2.4.2.2 Additional fitness tests

Hand grip strength

Isometric handgrip strength was used to assess upper limb muscle strength and measured using a digital hand dynamometer (JAMAR® Plus+, Sammons Preston, Bolingbrook, IL, USA) on the dominant hand only. Children were in a seated position with the elbow of the dominant hand flexed at 90° to the side of the body and were instructed to squeeze as hard as they could for three seconds (Wind et al., 2010). High test-retest reliability was found in children and adolescents (ICC = .94 and .98, respectively) (Gerodimos, 2012).

Gait test

The gait test assessed postural balance in combination with a cognitive interference task. Gait parameters were measured on a 10 m instrumented walkway equipped with an OptoGait optoelectronic system (Microgait, Bolzano, Italy). In order to avoid speed changes at beginning and end of the walkway, two additional meters were added at the beginning and end of the walkway. In total, one test run and two trial runs were performed for both the single task (gait only) and the double task (gait and inference task). The gait parameters for each condition were averaged over the two test runs. The inference task consisted of counting backwards from a random number between 60 and 100 in steps of three. A new number was given for each test run and the number of calculations and errors were documented (Beurskens et al., 2015). If the child could not perform the calculation in this test, successively simplified versions were implemented until the child could perform the calculations. Simplifications consisted of lowering the starting number to a random number between 10 and 20 and if necessary further counting backwards in steps of one.

Balance test

The balance test assessed static balance in combination with a cognitive inference task. The balance test was performed on a force plate (Leonardo, Kistler, AMTI) to determine parameters of the center of pressure. Children had to balance on one leg with eyes open, with the raised leg bent at the knee at ~ 60° for 30 s (Figura et al., 1991). Similar to the EMOTIKON one leg balance test, the criteria for a failed attempt were release of the hands from the hips, contact of the raised leg with the supporting leg or the floor, and bouncing/tapping of the supporting leg. The same arithmetic interference task as for the gait test was utilised and one test and one trial run each with single and dual task conditions were performed.

2.4.3 Executive function

The children’s executive functions were assessed using the digit symbol substitution test, the trail making test, and the Simon task.

Digit symbol substitution test

The digit symbol substitution test was administered to assess attention and psychomotor processing speed. The children were presented with numbers from 1 to 9, with a symbol assigned to each number (see Figure 2.3). During the test, the children had 90 seconds to correctly assign the symbols to as many consecutive numbers as possible (Petermann & Petermann, 2011). The test was administered in a pen and paper version and performance was scored as the number of symbols correctly assigned in 90 seconds.

Figure 2.3: Substituted symbols to the numbers 1 to 9 in the digit symbol substitution test (adapted from Health ABC, 2005, p. 9)

Trail making test

The trail making test was used to assess mental flexibility and fine motor abilities, and consisted of two parts (i.e., version A and version B). In version A, children had to connect the numbers from 1 to 15 in ascending order as quickly as possible and without lifting the pencil. In version B, they had to connect the numbers from 1 to 8 and the letters from A to G in alternating ascending order, starting from 1, as quickly as possible without lifting the pencil (R. Reitan, 2004; Reitan, 1971; Reitan & Wolfson, 1995). Both versions were implemented in pen and paper and performance was evaluated as time to completion and number of errors.

Simon Task

The Simon task was implemented to assess inhibitory control of executive functions (Simon & Rudell, 1967). The implemented version of the Simon task was modeled after the “Simon paradigm” by von Bastian et al. (2016). Their code9 is available online and served as the source, which was converted into an app for the IPad. In this test, children were presented with stimuli (i.e., coloured circles) that varied according to their position on the screen (i.e., left or right) and colour (i.e., red or blue). The colour of the stimuli had to be identified as quickly as possible using fixed buttons at the bottom of the screen. Accordingly, the correct response button and the stimulus position could be congruent (i.e., stimulus on the same side as the correct answer button) or incongruent (i.e., stimulus on opposite side as the correct answer button; see examples in Figure 2.4). Six test runs were conducted, followed by three blocks of 20 stimuli as trial runs. Of note, to ensure a balanced test design, 30 test runs each were coded as congruent and incongruent and randomised in order to create a fixed protocol. This protocol was implemented on each trial, meaning that each child performed the same order of trials on each trial. Since the number of stimuli for side and colour was not set at 30 each, their distribution was slightly skewed towards blue stimuli (i.e., 32 blue and 28 red) and more severely skewed towards stimuli on the left side (i.e., 40 left and 20 right). Performance was evaluated as the mean reaction time for each trial averaged for the congruent and incongruent condition. The test was conducted with an IPad 6 (OSX 15.2.1, Apple Inc., Cupertino (CA), USA). The Simon effect can already be observed in children as young as 4 years old (Davidson et al., 2006) and is a reliable measure of inhibition in young adults (split-half reliability == .8) (Bastian et al., 2016).

Figure 2.4: Examplatory Simon task trials in congruent (left) and incongruent (right) condition

2.4.4 Physical activity

Physical activity was recorded with a pedometer and a physical activity questionnaire. The pedometer (Speedy, Kasper & Richter GmbH, Uttenreuth, Germany) utilised a three-dimensional motion sensor to count the number of daily steps. Pedometers were worn for seven days after each examination and children were instructed to wear them at all times. Their displays were covered to avoid interference between the number of steps displayed and the children’s behaviour. Pedometers have been shown to be a reliable assessment of physical fitness with high compliance in children (Clemes & Biddle, 2013). The physical activity questionnaire used was the “MoMo Activity Questionnaire” for children and adolescents. The questionnaire focuses on time spent in organised physical activity in schools, clubs, and outside clubs, as well as in daily life, and converts this information into gaily minutes spent on MVPA. It is a reliable tool for assessing physical activity in children (Bös et al., 2009; Jekauc et al., 2013; Schmidt et al., 2016).

2.4.5 Socioemotional well-being

Socioemotional well-being was assessed using the KidKindl questionnaire for children aged 7 to 13 (Ravens-Sieberer et al., 2007). The questionnaire assesses the child’s subjective well-being in relation to body, psyche, self-esteem, family, friends, and school with four questions each and answers on a scale from 0 (never) to 4 (always). The questionnaire has proven to be a reliable assessment of socioemotional well-being, with slightly higher scores for the version with a legal guardian (Ellert et al., 2011; Erhart et al., 2009). The questionnaire was completed by the children themselves and one of their legal guardians.

2.4.6 Socioeconomic status

Socioeconomic status was determined using the KiGGS questionnaire, which focused on the guardians’ schooling, professional qualifications, occupational status, employment, and income (Lampert et al., 2014). The questionnaire was filled out by all available guardians and answering the questionnaire was voluntary.

2.5 Descriptive group and study characteristics

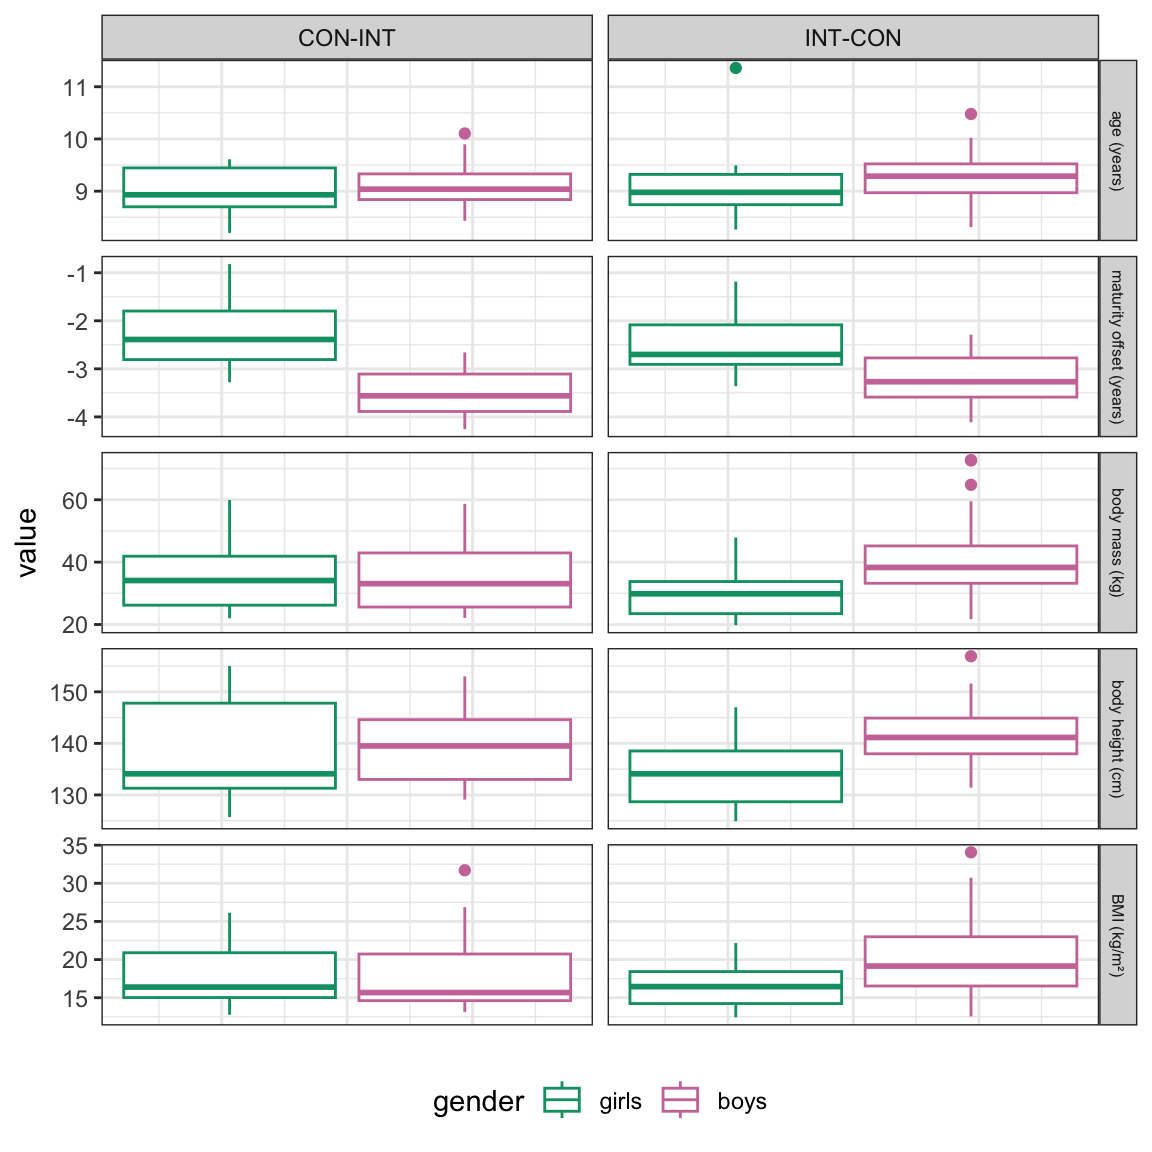
A total of 76 3rd grade students from eleven different primary schools in 9 different districts of the federal state of Brandenburg participated in the SMaRTER study. Six schools (44 children; 18 girls and 26 boys) were randomly assigned to the INT-CON group and 5 schools (32 children; 17 girls and 15 boys) to the CON-INT group. The number of children enrolled in each school ranged from 4 to 11, with a median of 6. The mean age at baseline was 9.2 ± 0.5 years and mean maturity offset was -2.9 ± 0.8 years according to Mirwald et al. (2002) and -2.9 ± 0.6 years according to Moore et al. (2015). The group- and gender-specific baseline-characteristics are reported in Table 2.2 and depicted in Figure 2.5.

Code
info |> 
  select(Child,gender, Group) |> 
  group_by(Child,Group) |> 
  summarise(gender=unique(gender)) |> 
  left_join(anthro |> select(Child, Time, mass, height, bmi)) |> 
  left_join(ages |> select(Child,Time,age, m_mirwald)) |> 
  subset(Time == "t0") |> 
  pivot_longer(mass:m_mirwald) |> 
  mutate(Group=factor(Group, levels = c("INT-CON", "CON-INT"))) |> 
  group_by(name, gender,Group) |> 
  summarise(m=paste0(round(mean(value),1),"±",round(sd(value),1))) |> 
  pivot_wider(names_from = c(Group, gender), values_from = c(m)) |> 
  ungroup() |> 
  add_row(name = "n", 
         `INT-CON_boy` = "26",
         `CON-INT_boy` = "15",
         `INT-CON_girl` = "18",
         `CON-INT_girl` = "17") |> 
  select(name, `INT-CON_girl`, `INT-CON_boy`, `CON-INT_girl`, `CON-INT_boy`) |> 
  mutate(name = case_when(name == "n" ~ "n",
                          name == "age" ~ "age (years)",
                          name == "m_mirwald" ~ "maturity offset (years)",
                          name == "mass" ~ "body mass (kg)",
                          name == "height" ~ "body height (cm)",
                          name == "bmi" ~ "BMI (kg/m²)"),
          name = factor(name, levels = c("n","age (years)", "maturity offset (years)", "body mass (kg)", "body height (cm)", "BMI (kg/m²)"))) |> 
  arrange(name) |> 
  flextable() |> 
  set_header_labels(
    name = "",
    `INT-CON_girl` = "girls",
    `INT-CON_boy` = "boys",
    `CON-INT_girl` = "girls",
    `CON-INT_boy` = "boys"
  ) |> 
  add_header_row(values = c("","INT-CON","CON-INT"), colwidths = c(1,2,2)) |> 
  add_footer_row(top = TRUE, values = "Participants baseline characteristics; n = number of included children; INT = intervention; CON = control condition; BMI = body mass index", colwidths = 5) |> 
  autofit() |> 
  border_remove() |>
  hline_bottom(border = officer::fp_border(width = 2), part = "header") |> 
  hline_top(border = officer::fp_border(width = 2), part = "header") |> 
  hline_bottom(border = officer::fp_border(width = 2), part = "footer")|> 
  hline_top(border = officer::fp_border(width = 2), part = "footer") 
Table 2.2: Baseline characteristics presented for group and gender

INT-CON

CON-INT

girls

boys

girls

boys

n

18

26

17

15

age (years)

9.1±0.7

9.3±0.5

9±0.4

9.1±0.5

maturity offset (years)

-2.5±0.6

-3.2±0.5

-2.2±0.8

-3.5±0.5

body mass (kg)

30.1±7.8

41.1±13.4

36.2±12.6

35.9±11.9

body height (cm)

133.9±6.5

141.3±6.1

139±9.9

139.3±7.5

BMI (kg/m²)

16.6±3

20.4±5.5

18.3±4.1

18.3±5.3

Participants baseline characteristics; n = number of included children; INT = intervention; CON = control condition; BMI = body mass index

Code
info |> 
  select(Child,gender, Group) |> 
  group_by(Child,Group) |> 
  summarise(gender=unique(gender)) |> 
  left_join(anthro |> select(Child, Time, mass, height, bmi)) |> 
  left_join(ages |> select(Child,Time,age, m_mirwald)) |> 
  subset(Time == "t0") |> 
  pivot_longer(mass:m_mirwald)|> 
  mutate(name = case_when(name == "n" ~ "n",
                          name == "age" ~ "age (years)",
                          name == "m_mirwald" ~ "maturity offset (years)",
                          name == "mass" ~ "body mass (kg)",
                          name == "height" ~ "body height (cm)",
                          name == "bmi" ~ "BMI (kg/m²)"),
          name = factor(name, levels = c("n","age (years)", "maturity offset (years)", "body mass (kg)", "body height (cm)", "BMI (kg/m²)")),
         gender=ifelse(gender=="girl", "girls", "boys"),
         gender=factor(gender, levels = c("girls", "boys"))) |> 
  ggplot(aes(y=value, group = gender, colour = gender)) +
  geom_boxplot() +
  facet_grid(name~Group, scales = "free_y") +
  scale_colour_manual(values = c(cbPalette[3:4])) +
  theme_bw() +
  theme(strip.text.y = element_text(size = 6),
        axis.text.x=element_blank(),
        axis.ticks.x=element_blank(),
        legend.position = "bottom")
Figure 2.5: Boxplots of anthropometric baseline characteristics depicted for group and gender; CON = control condition; INT = intervention; BMI = body mass index

2.5.1 Maturity offset

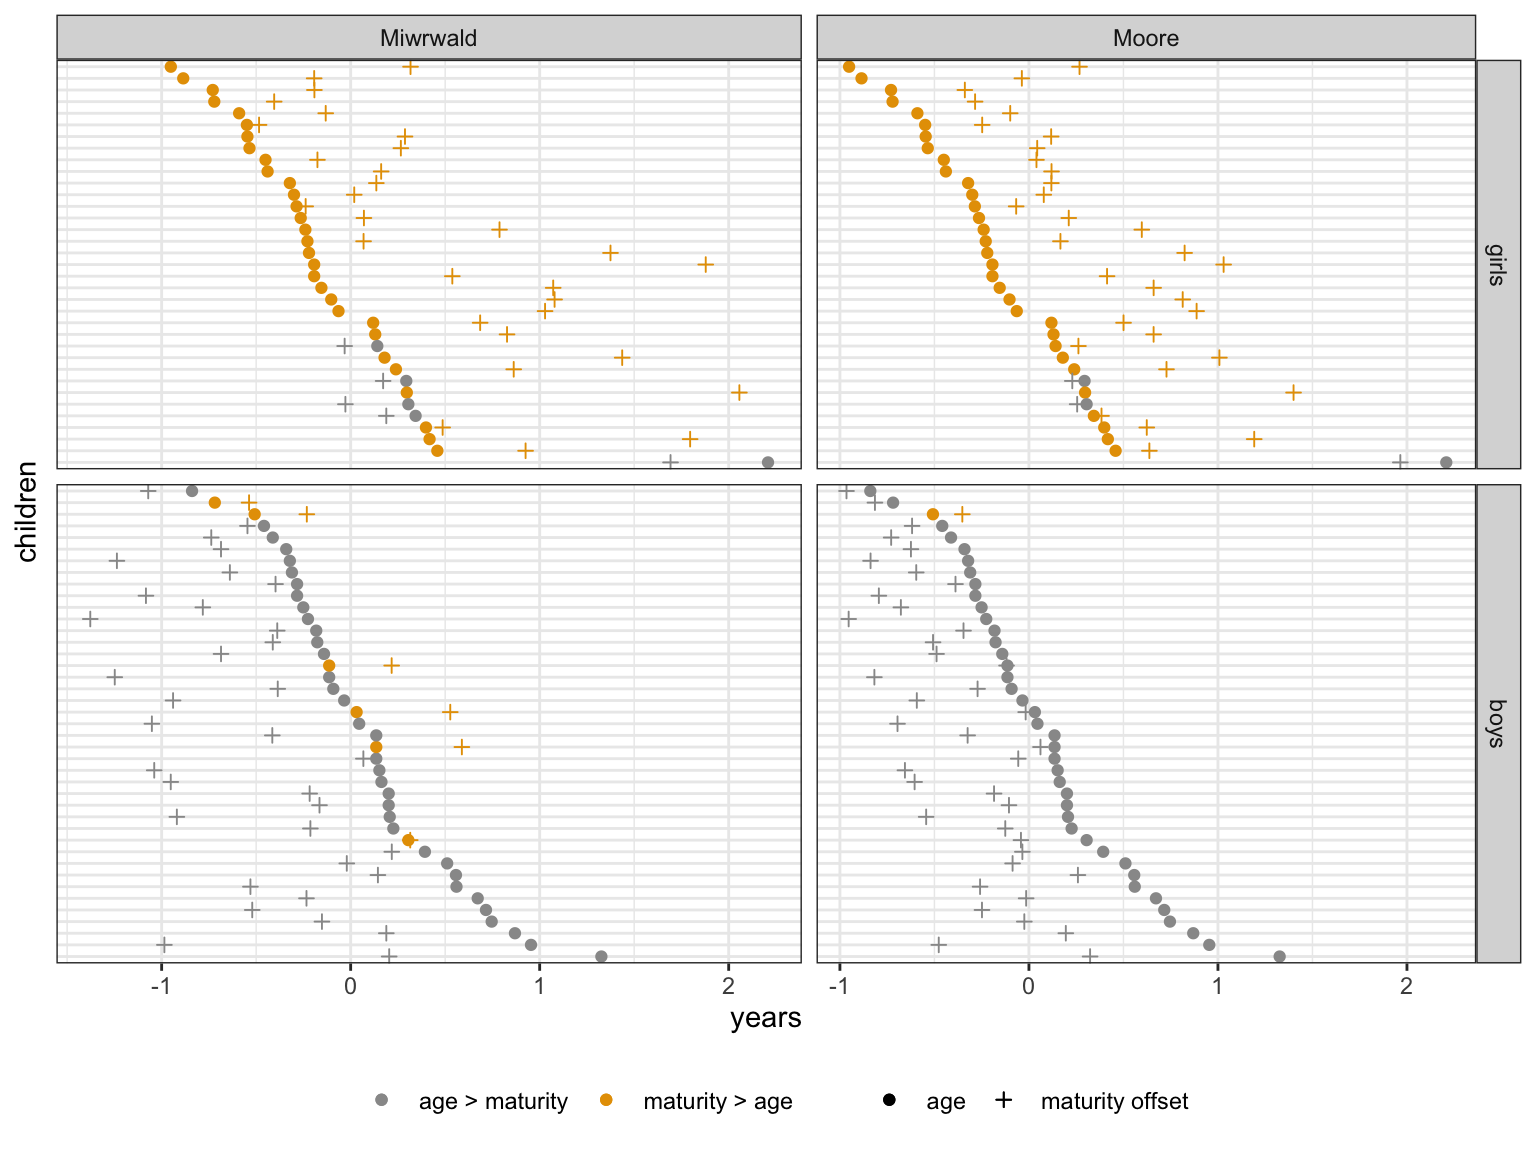
Although the participating children had similar ages at baseline, the maturity offset differed especially between girls and boys. Centering the baseline age and maturity offset at 0 according to the group mean showed almost all girls to have a higher maturity offset compared to their age, while the boys’ maturity offset was lower, with only minor differences between the different formulas. This is illustrated in Figure 2.6.

Code
info |>
  left_join(ages) |>
  pivot_longer(m_mirwald:m_moore) |> 
  subset(Time == "t0") |> 
  group_by(name) |> 
  mutate(across(where(is.character), as.factor),
         zAge=scale(age, scale=F),
         zMaturity=scale(value, scale=F),
         top=ifelse(zAge>zMaturity,"age > maturity", "maturity > age"),
         Author=ifelse(name=="m_mirwald","Miwrwald","Moore"),
         gender=ifelse(gender=="girl", "girls", "boys"),
         gender=factor(gender, levels = c("girls", "boys"))) |> 
  ungroup() |> 
  select(Child,zAge,zMaturity,gender,Author, top) |>
  arrange(zAge) |> 
  ggplot(aes(x=zAge,y=reorder(Child,-zAge), group = gender, colour=top)) +
  geom_point(aes(shape = "age")) +
  geom_point(aes(x = zMaturity, shape = "maturity offset")) +
  facet_grid(gender~Author, scales = "free", space = "free") +
  ylab("children") +
  xlab("years") +
  scale_colour_manual(values = c(cbPalette[7:8])) +
  scale_shape_manual(values = c(19,3)) +
  theme_bw() +
  theme(legend.position="bottom",
        legend.title = element_blank(),
        axis.text.y=element_blank(),
        axis.ticks.y=element_blank())
Figure 2.6: Difference between age and maturity offsets according to Mirwald (Mirwald et al., 2002) and Moore (Moore et al., 2015) in boys and girls, both centered at 0

2.5.2 Socioeconomic information

Code
#social_info <- readxl::read_excel("~/Documents/01_work/01_SMaRTER/11_datensatz/t0.xlsx", sheet="social_status") 
#save(social_info, file="data/social_info.rda")
load(file="data/social_info.rda") 

social_info <- social_info |>
  mutate(income.incomegroup = case_when(income.incomegroup == "O 2750 - 3000" ~ 2875,
                                        income.incomegroup == "O 2750 - 3000" ~ 2875,
                                        income.incomegroup == "Z 5000 - 5500" ~ 5250,
                                        income.incomegroup == "N 1500 - 1750" ~ 1625,
                                        income.incomegroup == "R 1750 - 2000" ~ 1875,
                                        income.incomegroup == "A 4500 - 5000" ~ 4750,
                                        income.incomegroup == "Q 6000 - 7500" ~ 6750,
                                        income.incomegroup == "U 3500 - 3750" ~ 3625,
                                        income.incomegroup == "J 3750 - 4000" ~ 3875,
                                        income.incomegroup == "K 2500 - 2750" ~ 2625,
                                        income.incomegroup == "C 3000 - 3250" ~ 3125,
                                        income.incomegroup == "H 1000 - 1250" ~ 1125,
                                        income.incomegroup == "F/E 750" ~ 750,
                                        income.incomegroup == "M 2000 - 2250" ~ 2125,
                                        income.incomegroup == "S 2250 - 2500" ~ 2375,
                                        income.incomegroup == "G 3250 - 3500" ~ 3375,
                                        income.incomegroup == "X 5000 - 6000" ~ 5500,
                                        income.incomegroup == "V 4000 - 4500" ~ 4250)) 
child <- social_info |>
  subset(parent == "p2") |>
  select(Child) |>
  unlist()
# both parents 
# living with partner/1 hh (SMART62 2 hh)
# <= 2 people producing income in hh
social_data_1 <- social_info |>
  subset(Child %in% child & 
           demo.livingwithpartner == "y" &
           income.nperson <= 2 &
           Child != "SMART62") |>
  group_by(Child) |>
  summarize(n_hh = mean(income.nhoushold),
            n_inc = mean(income.nperson),
            income_hh = mean(ifelse(income.monthlyincometotal != 9999999,
                               income.monthlyincometotal, income.incomegroup)),
            work = mean(work.workhours, na.rm=T))

# both parents 
# living with partner
# > 2 people producing income in hh
social_data_2 <-social_info |>
  subset(Child %in% child & 
           demo.livingwithpartner == "y" &
           income.nperson > 2 &
           Child != "SMART62") |>
  group_by(Child) |>
  summarize(n_hh = mean(income.nhoushold),
            n_inc = mean(income.nperson),
            income_hh = mean(ifelse(income.monthlyincometotal != 9999999,
                               income.monthlyincometotal, income.incomegroup)),
            work = mean(work.workhours, na.rm=T))

# both parents 
# not living with partner/multiple hh
social_data_3 <- social_info |>
  subset((Child %in% child & 
           demo.livingwithpartner == "n") |
           Child == "SMART62") |>
  group_by(Child,parent) |>
  summarize(n_hh = mean(income.nhoushold),
            n_inc = mean(income.nperson),
            income_hh = mean(ifelse(income.monthlyincometotal != 9999999,
                               income.monthlyincometotal, income.incomegroup)),
            work = mean(work.workhours, na.rm=T)) |>
  ungroup(parent) |>
  summarize(n_hh = mean(n_hh),
            n_inc = mean(n_inc),
            income_hh = mean(income_hh),
            work = mean(work))

# information only for one parent
social_data_4 <- social_info |>
  subset(!(Child %in% child)) |>
  group_by(Child) |>
  summarize(n_hh = mean(income.nhoushold),
            n_inc = mean(income.nperson),
            income_hh = mean(ifelse(income.monthlyincometotal != 9999999,
                               income.monthlyincometotal, income.incomegroup)),
            work = mean(work.workhours, na.rm=T))

social_data <- rbind(social_data_1,
                     social_data_2,
                     social_data_3,
                     social_data_4) |>
  mutate(income_pp = income_hh/n_hh,
         income_ip = income_hh/ifelse(n_inc==0,NA,n_inc))

rm(social_data_1, social_data_2, social_data_3, social_data_4, child)

social_data_acc <- social_data |>
  select(Child,income_hh, income_pp) |>
  pivot_longer(2:3) |>
  na.omit() |>
  group_by(name) |>
  arrange(name,value) |>
  mutate(value_acc=cumsum(value),
         n=1:n())

gini_income_hh <- 100*md_compute_gini(social_data_acc |> 
                                        subset(name == "income_hh") |> 
                                        ungroup(name) |>
                                        select(value), rep(1,46))

gini_income_pp <- 100*md_compute_gini(social_data_acc |> 
                                        subset(name == "income_pp") |> 
                                        ungroup(name) |>
                                        select(value), rep(1,46))

The socioeconomic data of the guardians were only collected at the beginning of the study, as the last assessment could not be completed (see Figure 2.1). 117 guardians provided a total of socioeconomic information corresponding to 68 children. For 19 children, one guardian’s information and for 49 children, two guardians’ information was provided. As socioeconomic data was not consistently available for all children and is likely to be biased is it was requested and provided on a voluntary basis (Goyder et al., 2002), socioeconomic information is only reported as a sample descriptor but not further included in the analyses.

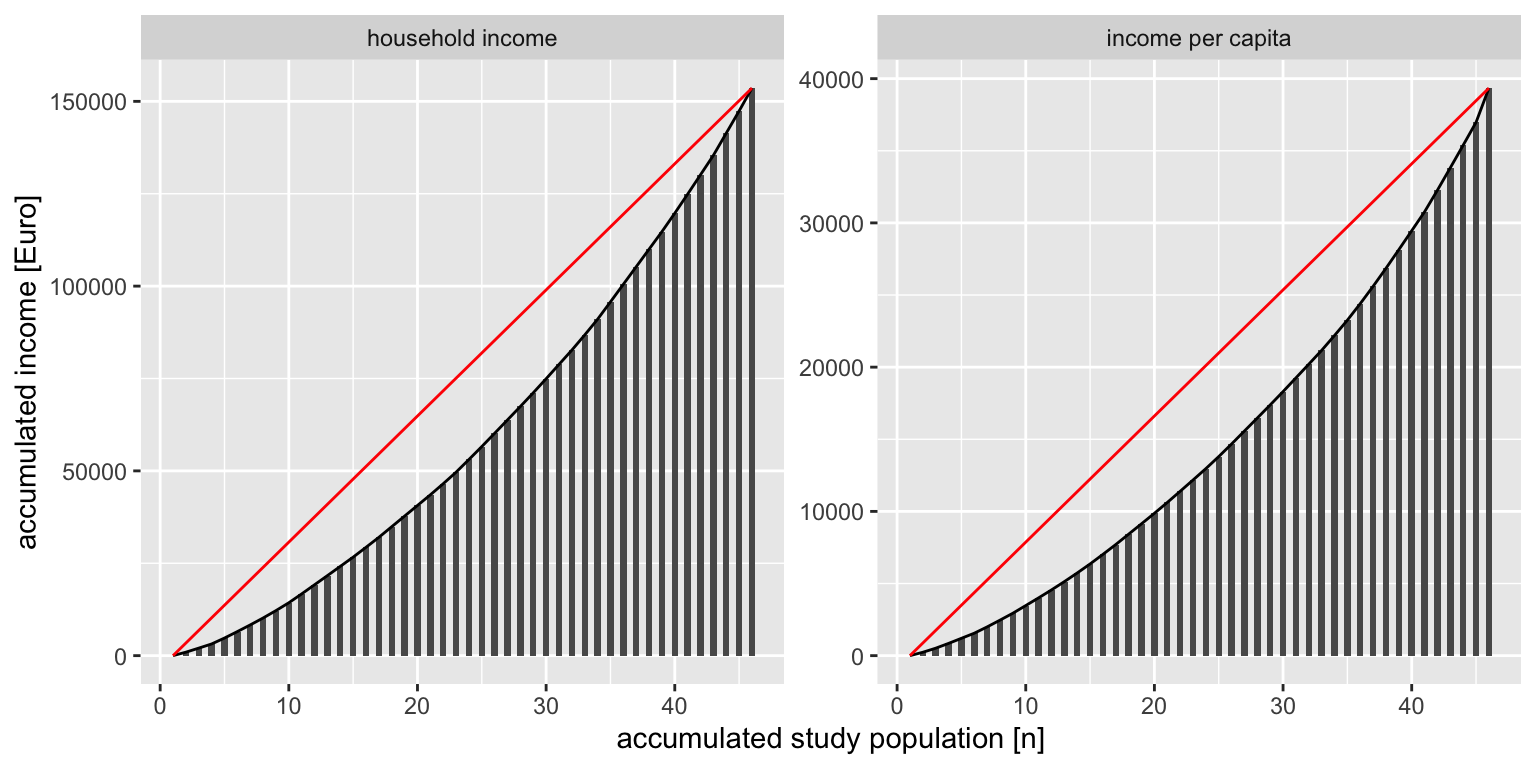
61 guardians were female, 54 male (2 missing), the average age was 40 ± 7 years (10 missings), 112 reported being German, and one each was Italian, Afghan, and Serbian (2 missings). In 17 guardians the highest school degree was “Hauptschulabschluss”, in 31 “Realschulabschluss”, in eight “Abschluss der polytechnischen Oberschule”, in 17 “Fachhochschulreife”, in 34 “Hochschulreife/Abitur”, in one “erweiterter Hauptschulabschluss”, and two did not graduate from any school (8 missings). 53 guardians did full-time paid labour (42 ± 8.6 hours/week), 36 did part-time paid labour (29 ± 6 hours/week), and 12 were unemployed. The remaining guardians were in training (1), in a mini-job or occasionally employed (5), or on parental leave (1) (8 missings). Regarding working hours per week, one guardian reported 168 working hours/week, noting that their unpaid care work was equivalent to a 24/7 working week. The information on income was provided by the legal guardians of 46 participating children. The average household income10 was 3,338.84 ± 1,444.97 € and was earned on average by two individuals per household (range 1 to 4) with an average income11 of 1,819.49 ± 677.78 € (2 missings). This resulted in an average household income per capita of 855.31 ± 438.68 € in the study sample. The distribution of household income and household income per capita within the study sample is shown using a Lorenz curve12 in Figure 2.7. Furthermore, the Gini index was calculated for the sample according to the formula of the World Bank (Bank, 2023). The Gini index provides information on the equality of income distribution within a group13 and was calculated for household income (Gini index = 24.32) and household income per capita (Gini index = 27.51). Using country-specific reference values, Gini indices of 50 to 70 indicate very unequal income distribution, while countries with a Gini index of 20 to 35 indicate relatively equal distribution (Willis, 2020).

Code
social_data_acc |>
  mutate(value_acc_av = case_when(name=="income_hh"~value_acc/153586.51*46,
                                  name=="income_pp"~value_acc/39344.26*46),
         line = case_when(name=="income_hh" & Child %in% c("SMART27", "SMART15")~value_acc,
                          name=="income_pp" & Child %in% c("SMART27", "SMART22")~value_acc),
         n2 = case_when(name=="income_hh" & Child %in% c("SMART27", "SMART15")~n,
                          name=="income_pp" & Child %in% c("SMART27", "SMART22")~n),
         name = ifelse(name=="income_hh", "household income", "income per capita"),
         name = factor(name, levels = c("household income", "income per capita"))) |>
  ggplot(aes(x=n,y=value_acc)) +
  geom_col(width = 0.5) +
  geom_line() +
  geom_line(aes(x=n2,y=line, group=name),colour="red") +
  xlab("accumulated study population [n]") +
  ylab("accumulated income [Euro]") +
  facet_wrap(.~name, scales = "free") 
Figure 2.7: Distribution of household income and income per capita illustrated using Lorenz curve plots

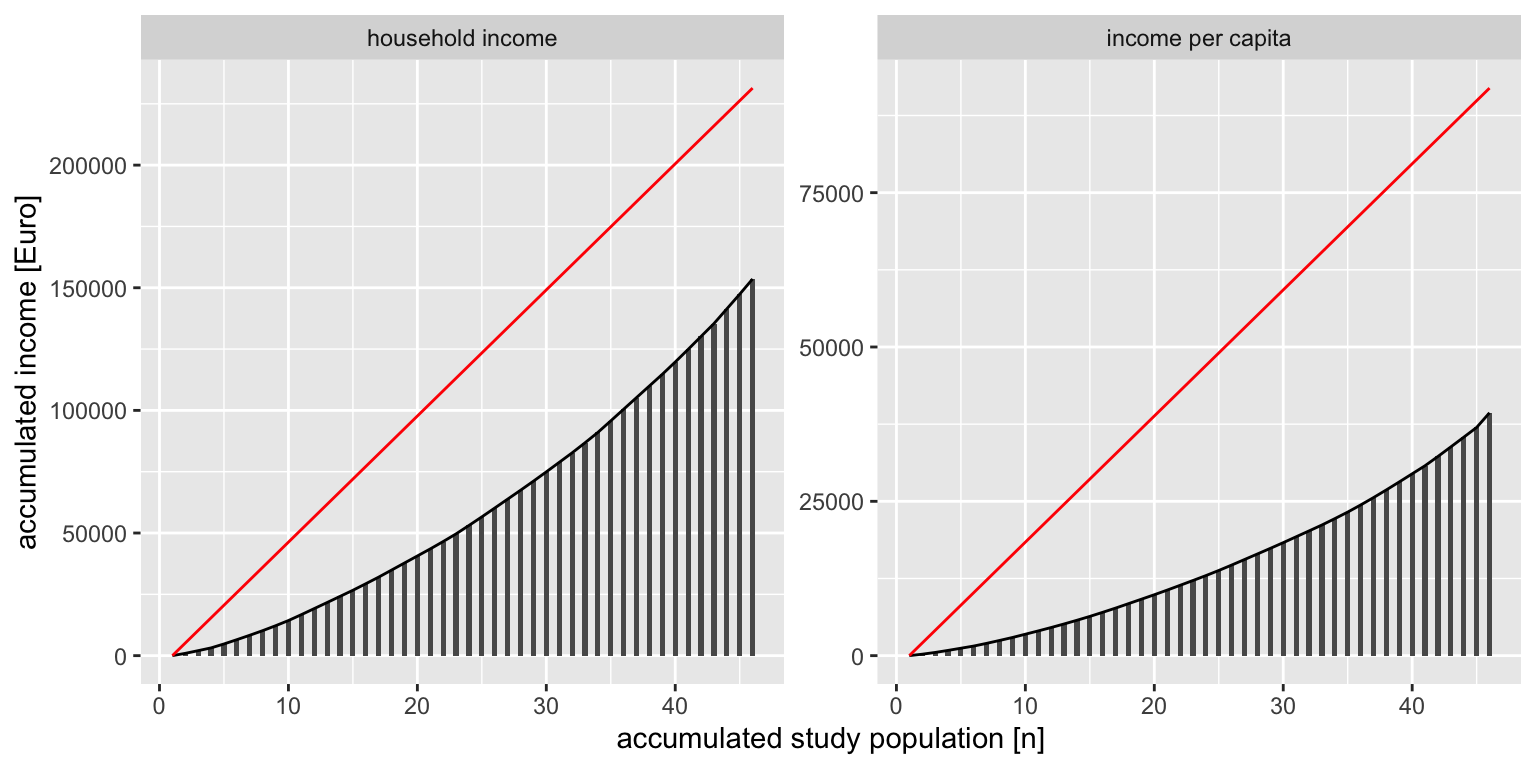
The Gini indices and Lorenz curves of the sample indicate that household income and income per capita are relatively evenly distributed within the sample. However, in 2019, the average annual household income in the federal state of Brandenburg was €60,366 and the average income per capita was €23,984 (Amt für Statistik, 2021). This results in an average monthly household income of €5,030.50 and an income per capita of €1,998.6714. Compared to the included sample, only 6 of the 46 households had above average household income and only one child had values above the average income per capita. To illustrate the discrepancy, a Lorenz curve was plotted with an adjusted 45° line for the average income in Figure 2.8.

Code
social_data_acc |>
  subset(name %in% c("income_hh","income_pp")) |>
  mutate(line = case_when(name == "income_hh" & Child == "SMART27" ~ 0, 
                          name == "income_hh" & Child == "SMART15" ~ 60366/12*46,
                          name == "income_pp" & Child == "SMART27" ~ 0,
                          name == "income_pp" & Child == "SMART22" ~ 23984/12*46),
         n2 = case_when(name=="income_hh" & Child %in% c("SMART27", "SMART15")~n,
                          name=="income_pp" & Child %in% c("SMART27", "SMART22")~n),
         name = ifelse(name=="income_hh", "household income", "income per capita"),
         name = factor(name, levels = c("household income", "income per capita"))) |>
  ggplot(aes(x=n,y=value_acc)) +
  geom_col(width = 0.4) +
  geom_line() +
  geom_line(aes(x=n2,y=line, group=name),colour="red") +
  xlab("accumulated study population [n]") +
  ylab("accumulated income [Euro]") +
  facet_wrap(.~name, scales = "free") 
Figure 2.8: Distribution of household income and income per capita illustrated using Lorenz curve plots with adjusted 45° line for the average household income income and income per capita of the federal state of Brandenburg in 2019

2.6 Study dropout

Continuous drop-out from the SMaRTER study is shown in Figure 2.9. Reasons given for dropping out between t0 and t3 were changing schools (4 children) and the increased time required for the additional remedial physical education classes of the SMaRTER study (6 children). Students who dropped out between t6 (16 students) and t8 (13 students) withdrew (or no longer gave consent to participate in the study) due to additional workload and/or increased risk of SARS-CoV-2 infections due to the Covid 19 pandemic.

Code
gg_bar1 <- info |>
    group_by(Time,school) |>
    summarise(n=sum(Dropout)) |>
    ggplot(aes(x=Time, y=n, fill=school)) +
    geom_bar(stat="identity", width = 0.8) +
    geom_text(data=info |>
                 group_by(Time) |>
                 summarise(n=sum(Dropout),
                           school=NA), 
              aes(y=n+2, label=n)) +
    xlab("") + 
    ylab("N") + 
    ggtitle("A") +
    theme_classic()

gg_bar2 <- info |>
  mutate(gender=paste0(gender,"s")) |> 
    group_by(Time,gender,Group) |>
    summarise(n=sum(Dropout)) |>
    ggplot(aes(x=Time, y=n)) +
    geom_bar(aes(fill=Group), 
             stat="identity",
             width = 0.4, 
             just=1) +
    geom_bar(aes(group=Group,fill=gender), 
             stat="identity", 
             width = 0.4,
             just=0) +
    geom_text(data=info |>
                 group_by(Time) |>
                 summarise(n=sum(Dropout),
                           gender=NA,
                           Group=NA), 
              aes(y=n+2, label=n)) +
    xlab("") + 
    ylab("N") + 
    ggtitle("B") +
    scale_fill_manual(breaks = c("INT-CON", "CON-INT", "girls", "boys"),
                      values = c(cbPalette[c(1,2,3,4)]))+
    theme_classic()


gridExtra::grid.arrange(gg_bar1 + theme(legend.position="none"),
                        cowplot::get_legend(gg_bar1),
                        gg_bar2 + theme(legend.position="none"),
                        cowplot::get_legend(gg_bar2),
  ncol = 2, nrow = 2, widths=c(4,1))
Figure 2.9: Depictions of dropouts across all assessments A Dropout in relation to schools; B Dropout in relation gender per intervention group; N = number of participants left in sample; INT-CON = intervention control; CON-INT = control intervention

2.7 Anthropometric group differences

Before analysing intervention effects in physical fitness or executive function, possible group and gender differences were analysed for the variables age, maturity offset (according to Mirwald et al. (2002)) and the anthropometric measures body height, body mass, and BMI (presented in Figure 2.10).

Code
left_join(info, ages) |>
  left_join(anthro) |>
  select(Group, school, Date, Time, Child, gender, age, height, mass, m_mirwald, bmi) |> 
  pivot_longer(7:11, names_to = "Measure", values_to = "Score") |> 
  group_by(Measure, Time, gender, Group) |> 
  summarise(N=n(), 
            n=sum(!is.na(Score)), 
            m=mean(Score, na.rm=TRUE), 
            sd=sd(Score, na.rm=TRUE), 
            se=sd/sqrt(n),
            Measure=case_when(Measure=="age"~"age [years]",
                              Measure=="m_mirwald"~"maturity offset [years]",
                              Measure=="height"~"body height [cm]",
                              Measure=="mass"~"body mass [kg]",
                              Measure=="bmi"~"BMI [kg/m²]"),
            Measure=factor(Measure, levels = c("age [years]", "maturity offset [years]", "body height [cm]", "body mass [kg]", "BMI [kg/m²]")),
         gender=ifelse(gender=="girl", "girls", "boys"),
         gender=factor(gender, levels = c("girls", "boys"))) |> 
  ggplot(aes(x=Time, y=m, group=Group, colour=Group)) +
  geom_point(position=position_dodge(0.2)) + 
  geom_line(position=position_dodge(0.2)) +
  geom_errorbar(aes(ymin=m-sd,ymax=m+sd), width = 0.1, position=position_dodge(0.2)) +
  facet_grid(rows=vars(Measure), cols=vars(gender), scales="free_y") +
  ylab("mean values [± standard deviation]") +
  theme_bw() + 
  scale_colour_manual(breaks = c("INT-CON", "CON-INT"), values = c(cbPalette)) +
  theme(strip.text.y = element_text(size = 6),
        legend.position = "bottom")
Figure 2.10: Group and gender differences over time for age, maturity offset (Mirwald), body height, body mass, and body mass index (BMI).

Since the different displayed values are highly interdependent, meaning partly computed from each other, the differences between the genders and groups were investigated for the BMI only using LMMs.

The LMMs were adjusted with BMI as the dependent variable and the interaction of Group x Gender x Time as fixed factors. Child and School were included as random factors. Successive difference contrasts were set for the variables Group, Gender, and Time.

Code
data <- left_join(info, anthro) |>
  select(Child, school, Group, gender, Time, bmi) |> 
  mutate(across(where(is.character), as.factor)) 

contrasts(data$Group) <- MASS::contr.sdif(2)
contrasts(data$gender)  <- MASS::contr.sdif(2)
contrasts(data$Time) <- MASS::contr.sdif(6)
m_bmi <- lmer(bmi ~ 1 + Group*gender*Time + (1 | Child) + (1 | school), data=data, REML=FALSE,
              control=lmerControl(calc.derivs=FALSE))

LMM revealed that (1) the BMI of boys in the INT-CON group is higher compared to boys in the CON-INT group, while the reverse is true for girls, and (2) the BMI of girls in the CON-INT group shows a greater improvement between t2 and t3 and between t6 and t8 compared to girls in the INT-CON group, while the reverse is true for boys between t6 and t8. The results are shown in Table 2.3 and depicted in Figure 2.10. Accordingly, the BMI is included in the models to evaluate the intervention effects. Missing values are replaced by earlier available values. Due to dropouts, the Group x Gender x Time interactions for BMI were additionally tested using LMMs for all children who were present at t1 and t3. Results of these LMMs are reported in the Appendix Section 8.2.1 and show the same pattern.

Code
tab1 <- tab_model(m_bmi, digits=2, digits.re=2, show.se=TRUE, show.stat=TRUE, show.ci=FALSE,CSS = css_theme("cells"),
                  pred.labels = c("Grand mean", "Group2-1", "gender2-1", "Time2-1", "Time3-2", "Time4-3", "Time5-4", "Time6-5", "Group2-1 * gender2-1", "Group2-1 * Time2-1", "Group2-1 * Time3-2", "Group2-1 * Time4-3", "Group2-1 * Time5-4", "Group2-1 * Time6-5", "gender2-1 * Time2-1", "gender2-1 * Time3-2", "gender2-1 * Time4-3", "gender2-1 * Time5-4", "gender2-1 * Time6-5", "Group2-1 * gender2-1 * Time2-1", "Group2-1 * gender2-1 * Time3-2", "Group2-1 * gender2-1 * Time4-3", "Group2-1 * gender2-1 * Time5-4", "Group2-1 * gender2-1 * Time6-5")) 

tab_to_flex(tab1,"")
Table 2.3: Group x gender x Time interactions for body mass index across all assessments

Predictors

Est.

SE

z

p

Grand mean

19.26

0.83

23.30

<0.001

Group2-1

0.35

1.65

0.21

0.832

gender2-1

-2.12

1.05

-2.01

0.045

Time2-1

0.17

0.14

1.17

0.243

Time3-2

0.31

0.15

2.09

0.038

Time4-3

0.43

0.16

2.71

0.007

Time5-4

0.53

0.18

2.91

0.004

Time6-5

0.86

0.20

4.33

<0.001

Group2-1 * gender2-1

-4.77

2.11

-2.26

0.024

Group2-1 * Time2-1

0.03

0.29

0.09

0.924

Group2-1 * Time3-2

-0.44

0.30

-1.47

0.143

Group2-1 * Time4-3

-0.17

0.32

-0.54

0.588

Group2-1 * Time5-4

0.47

0.36

1.30

0.196

Group2-1 * Time6-5

-0.45

0.40

-1.15

0.251

gender2-1 * Time2-1

0.24

0.29

0.83

0.409

gender2-1 * Time3-2

0.08

0.30

0.26

0.791

gender2-1 * Time4-3

0.17

0.32

0.54

0.591

gender2-1 * Time5-4

0.03

0.36

0.07

0.941

gender2-1 * Time6-5

-0.04

0.40

-0.10

0.924

Group2-1 * gender2-1 * Time2-1

0.10

0.58

0.18

0.857

Group2-1 * gender2-1 * Time3-2

0.16

0.60

0.27

0.786

Group2-1 * gender2-1 * Time4-3

-1.49

0.64

-2.33

0.021

Group2-1 * gender2-1 * Time5-4

0.57

0.73

0.79

0.429

Group2-1 * gender2-1 * Time6-5

-2.31

0.79

-2.91

0.004

Random Effects

σ2

0.70

τ00Child

17.68

τ00school

4.63

ICC

0.97

N Child

76

N school

11

Observations

348

Marginal R2 / Conditional R2

0.133 / 0.974

Est. = estimate; SE = standar error

2.8 Analysis plan

The first analysis focuses on the effects of remedial physical education on physical fitness and executive function and is reported in Chapter 3.

Although various assessments of physical fitness were available for the analysis, this thesis focuses on the EMOTIKON tests as the main outcome. Focusing on EMOTIKON tests allowed for a standardisation of data using the population mean and standard deviation previously published (Fühner et al., 2021, 2022). In addition, based on the findings of Fühner et al. (Fühner et al., 2021, 2022), physical fitness is understood as a latent construct, represented by the four EMOTIKON tests: standing long jump, 20 m sprint, 6 min run and star run. Additionally, executive function as a secondary outcome is included in the analysis, consisting of the trail making test (i.e., time to completion for version A and B) (R. Reitan, 2004; Reitan, 1971; Reitan & Wolfson, 1995), the digit symbol substitution test (Petermann & Petermann, 2011), and the Simon task (i.e., mean reaction time in the congruent and incongruent condition) (Simon & Rudell, 1967). Of note, other physical fitness assessments (i.e., hand grip strength, gait test, and balance test), as well as physical activity and socio-emotional well-being were assessed for potential intervention related effects, but are not included in this report. Significant intervention-related effects will be included in the following analyses.

The second analysis explores the relationship between anthropometric parameters and physical fitness and is conducted in Chapter 4. Due to internal calculations, the anthropometric parameters estimated with InBody showed unexpectedly high correlations between body mass and other measures such as fat mass (r = .95), muscle mass (r = .92) and the sum value of muscle and fat mass (r = 1; see Appendix Section 8.4.1), indicating that the values are estimated applying a linear transformation model undisclosed by the manufacturer. Therefore, only body height and mass were analysed in relation to physical fitness. In addition to the physical fitness tests included in the first analysis, this analysis further included ball push test. This test was included based on the assumption that a higher body mass might be beneficial for test performances, thus revealing a potential positive relationship compared to the other tests, where a higher body mass is expected to be detrimental to test performances (see Section 1.2 for details).

The third analysis is focused on the relationship between maturity offset and physical fitness and is conducted in Chapter 5. The main goal is to analyse the effect of the maturity offset in relation to age on physical fitness. This is tested for the maturity offset according to Mirwald et al. (2002) as well as Moore et al. (2015). Physical fitness follows the same conceptualisation the intervention analysis in Chapter 3.

The fourth analysis examines the interaction between physical fitness and executive function (Chapter 6). Due to the availability of raw data from the Simon task, there was a unique opportunity to evaluate a high number of data points (i.e., 60 trials per child per evaluation), which are not available for digit symbol substitution and trail making test (i.e., 1 or 2 data points per child per evaluation). This allowed for a sensitive analysis of physical fitness parameters as variance components of an executive function task. Accordingly, executive function was defined as reaction times of each Simon task trial. Effects of physical fitness on executive function were assessed for all EMOTIKON tests to allow for a more distinct understanding of how different aspects of physical fitness might be associated with executive function.

2.9 Statistical information

Data preprocessing and analyses in Chapter 3, Chapter 4, and Chapter 5 was done with R [4.2.1; (R Core Team, 2022)]. Chapter 6 additionally used Julia [1.8.2, (Bezanson et al., 2017)].

Utilised package for preprocessing in R was the ‘tidyverse’ package (Wickham et al., 2019). Liner mixed models (LMM) estimation, supplementation, and post-processing in R was done using the ‘lme4’ package (Bates et al., 2015), the ‘MASS’ package (Venables & Ripley, 2002), the ‘remef’ package (Hohenstein & Kliegl, 2022), the ‘sjPlot’ package (Lüdecke, 2021), and the ‘performance’ package (Lüdecke et al., 2021). In Julia LMMs were estimated with the ‘MixedModels.jl’ package (Bates et al., 2023), and the ‘MixedModelsExtras.jl’ package (Alday, 2022) was used for data analysis and post-processing of LMMs.

Plotting of data was done in R using the ‘ggplot2’ package (Wickham, 2016), the ‘gridExtra’ package (Auguie, 2017), and the ‘car’ package (Fox & Weisberg, 2019). Further, tabular presentation of data was done using the ‘flextable’ package (Gohel & Skintzos, 2022) and the ‘officer’ package (Gohel, 2022) in R.


  1. See https://www.uni-potsdam.de/fileadmin/projects/emotikon/SMaRTER-Studie/SMaRTER-Studie_Trainingsintervention_2019.pdf↩︎

  2. See https://www.uni-potsdam.de/fileadmin/projects/emotikon/SMaRTER-Studie/SMaRTER-Studie_Trainingsintervention_2019.pdf↩︎

  3. The names of the homework exercises are originally in German. Accordingly, some language-specific meaning may be lost in translation into English.↩︎

  4. A list of schools employing specially trained remedial physical education teachers was provided by the MBJS.↩︎

  5. See this https://www.uni-potsdam.de/de/emotikon/index or Section 1.1.3.2 for more details on the EMOTIKON study.↩︎

  6. Once at the start of the SMaRTER study and once at the first assessment during the Covid 19 pandemic (i.e., t6).↩︎

  7. VO2max was determined using a spiroergometer and a standardised protocol with increasing speed and incline (Dubowy et al., 2008).↩︎

  8. In the shuttle run, participants had to run back and forth along a 20 m track, the pace being increased every minute by an acoustic signal until the participants could no longer maintain the pace.↩︎

  9. See http://www.tatool-web.com/#!/doc/lib-exp-simon.html↩︎

  10. Household income was estimated for each child. If a child lived in more than one household, income was averaged across all associated households.↩︎

  11. Average income was estimated by dividing the household income by all individuals contributing to the household income.↩︎

  12. The Lorenz curve plots the cumulative income share (on the y-axis) against the cumulative population share (on the x-axis). If the income distribution in the population is completely equal, the Lorenz curve assumes a 45° line (Bank, 2023).↩︎

  13. The Gini index calculates the area between a horizontal 45° line (which means perfect equality) and the plotted Lorenz curve (see footnote above). Accordingly, a Gini index of 0 represents perfect equality and a value of 100 represents perfect inequality (Willis, 2020).↩︎

  14. If the values are adjusted for the thirteenth salary, which is a voluntary bonus salary that the employer can pay at the end of the year and which can reach up to a full salary, the average monthly household income was €4,643.54 and the income per capita was €1,844.92.↩︎