Albrecht, C. A. (2015). Entwicklung und einflussfaktoren der entwicklung der motorischen leistungsfähigkeit im kindes- und jugendalter - befunde der MoMo-längsschnittstudie. Pädagogischen Hochschule Karlsruhe.
Andersen, K. L., Seliger, V., Rutenfranz, J., & Skrobak-Kaczynski, J. (1976). Physical performance capacity of children in norway.
European Journal of Applied Physiology and Occupational Physiology,
35.
https://doi.org/10.1007/bf00444656
Armstrong, N., & Welsman, J. (2007). Aerobic fitness: What are we measuring? In
Medicine and Sport Science (Vol. 50).
https://doi.org/10.1159/000101073
Bates, D. M., Kliegl, R., Vasishth, S., & Baayen, H. (2018). Parsimonious mixed models douglas bates. ArXiv e-Print, Under Revision.
Benjamin, H. J., & Glow, K. M. (2003). Strength training for children and adolescents: What can physicians recommend? In
Physician and Sportsmedicine (Vol. 31).
https://doi.org/10.1080/00913847.2003.11439938
Beunen, G. P., Rogol, A. D., & Malina, R. M. (2006). Indicators of biological maturation and secular changes in biological maturation. In
Food and Nutrition Bulletin (Vol. 27).
https://doi.org/10.1177/15648265060274s508
Bull, F. C., Al-Ansari, S. S., Biddle, S., Borodulin, K., Buman, M. P., Cardon, G., Carty, C., Chaput, J. P., Chastin, S., Chou, R., Dempsey, P. C., Dipietro, L., Ekelund, U., Firth, J., Friedenreich, C. M., Garcia, L., Gichu, M., Jago, R., Katzmarzyk, P. T., … Willumsen, J. F. (2020). World health organization 2020 guidelines on physical activity and sedentary behaviour. In
British Journal of Sports Medicine (Vol. 54).
https://doi.org/10.1136/bjsports-2020-102955
Castro-Piñero, J., González-Montesinos, J. L., Mora, J., Keating, X. D., Girela-Rejón, M. J., Sjöström, M., & Ruiz, J. R. (2009). Percentile values for muscular strength field tests in children aged 6 to 17 years: Influence of weight status.
Journal of Strength and Conditioning Research,
23.
https://doi.org/10.1519/JSC.0b013e3181b8d5c1
Castro-Piñero, J., Ortega, F. B., Keating, X. D., González-Montesinos, J. L., Sjöstrom, M., & Ruiz, J. R. (2011). Percentile values for aerobic performance running/walking field tests in children aged 6 to 17 years: Influence of weight status. Nutricion Hospitalaria : Organo Oficial de La Sociedad Espanola de Nutricion Parenteral y Enteral, 26.
Catley, M. J., & Tomkinson, G. R. (2013). Normative health-related fitness values for children: Analysis of 85347 test results on 9-17-year-old australians since 1985.
British Journal of Sports Medicine,
47.
https://doi.org/10.1136/bjsports-2011-090218
Deprez, D., Coutts, A. J., Fransen, J., Deconinck, F., Lenoir, M., Vaeyens, R., & Philippaerts, R. (2013). Relative age, biological maturation and anaerobic characteristics in elite youth soccer players.
International Journal of Sports Medicine,
34.
https://doi.org/10.1055/s-0032-1333262
Fredricks, J. A., & Eccles, J. S. (2005). Family socialization, gender, and sport motivation and involvement.
Journal of Sport and Exercise Psychology,
27.
https://doi.org/10.1123/jsep.27.1.3
Fühner, T., Granacher, U., Golle, K., & Kliegl, R. (2021). Age and sex effects in physical fitness components of 108,295 third graders including 515 primary schools and 9 cohorts.
Scientific Reports,
11.
https://doi.org/10.1038/s41598-021-97000-4
Fühner, T., Granacher, U., Golle, K., & Kliegl, R. (2022). Effect of timing of school enrollment on physical fitness in third graders. Nature - Scientific Reports, 12.
Golle, K., Granacher, U., Hoffmann, M., Wick, D., & Muehlbauer, T. (2014). Effect of living area and sports club participation on physical fitness in children: A 4 year longitudinal study.
BMC Public Health,
14.
https://doi.org/10.1186/1471-2458-14-499
Hawkins, D., & Metheny, J. (2001). Overuse injuries in youth sports: Biomechanical considerations.
Medicine and Science in Sports and Exercise,
33.
https://doi.org/10.1097/00005768-200110000-00014
Haywood, K. M., & Getchell, N. (2014). Life span motor development (M. Schrag, C. M. Drews, S. Huls, & M. J. Zavala, Eds.; 6th ed.). Human Kinetics.
Hotelling, H. (1933). Analysis of a complex of statistical variables into principal components.
Journal of Educational Psychology,
24.
https://doi.org/10.1037/h0071325
Kanehisa, H., Yata, H., Ikegawa, S., & Fukunaga, T. (1995). A cross-sectional study of the size and strength of the lower leg muscles during growth.
European Journal of Applied Physiology and Occupational Physiology,
72.
https://doi.org/10.1007/BF00964130
Kliegl, R. M. (1982). On relations between cognition and reading style: Individual differences and developmental trends. University of Colorado.
Lovell, R., Towlson, C., Parkin, G., Portas, M., Vaeyens, R., & Cobley, S. (2015). Soccer player characteristics in english lower-league development programmes: The relationships between relative age, maturation, anthropometry and physical fitness.
PLoS ONE,
10.
https://doi.org/10.1371/journal.pone.0137238
Lundgren, S. S., Nilsson, J. Å., Ringsberg, K. A. M., & Karlsson, M. K. (2011). Normative data for tests of neuromuscular performance and DXA-derived lean body mass and fat mass in pre-pubertal children.
Acta Paediatrica, International Journal of Paediatrics,
100.
https://doi.org/10.1111/j.1651-2227.2011.02322.x
Malina, R. M. (2004). Secular trends in growth, maturation and physical performance : A review. Anthropological Review, 67.
Miguel-Etayo, P. D., Gracia-Marco, L., Ortega, F. B., Intemann, T., Foraita, R., Lissner, L., Oja, L., Barba, G., Michels, N., Tornaritis, M., Molnár, D., Pitsiladis, Y., Ahrens, W., & Moreno, L. A. (2014). Physical fitness reference standards in european children: The IDEFICS study.
International Journal of Obesity,
38.
https://doi.org/10.1038/ijo.2014.136
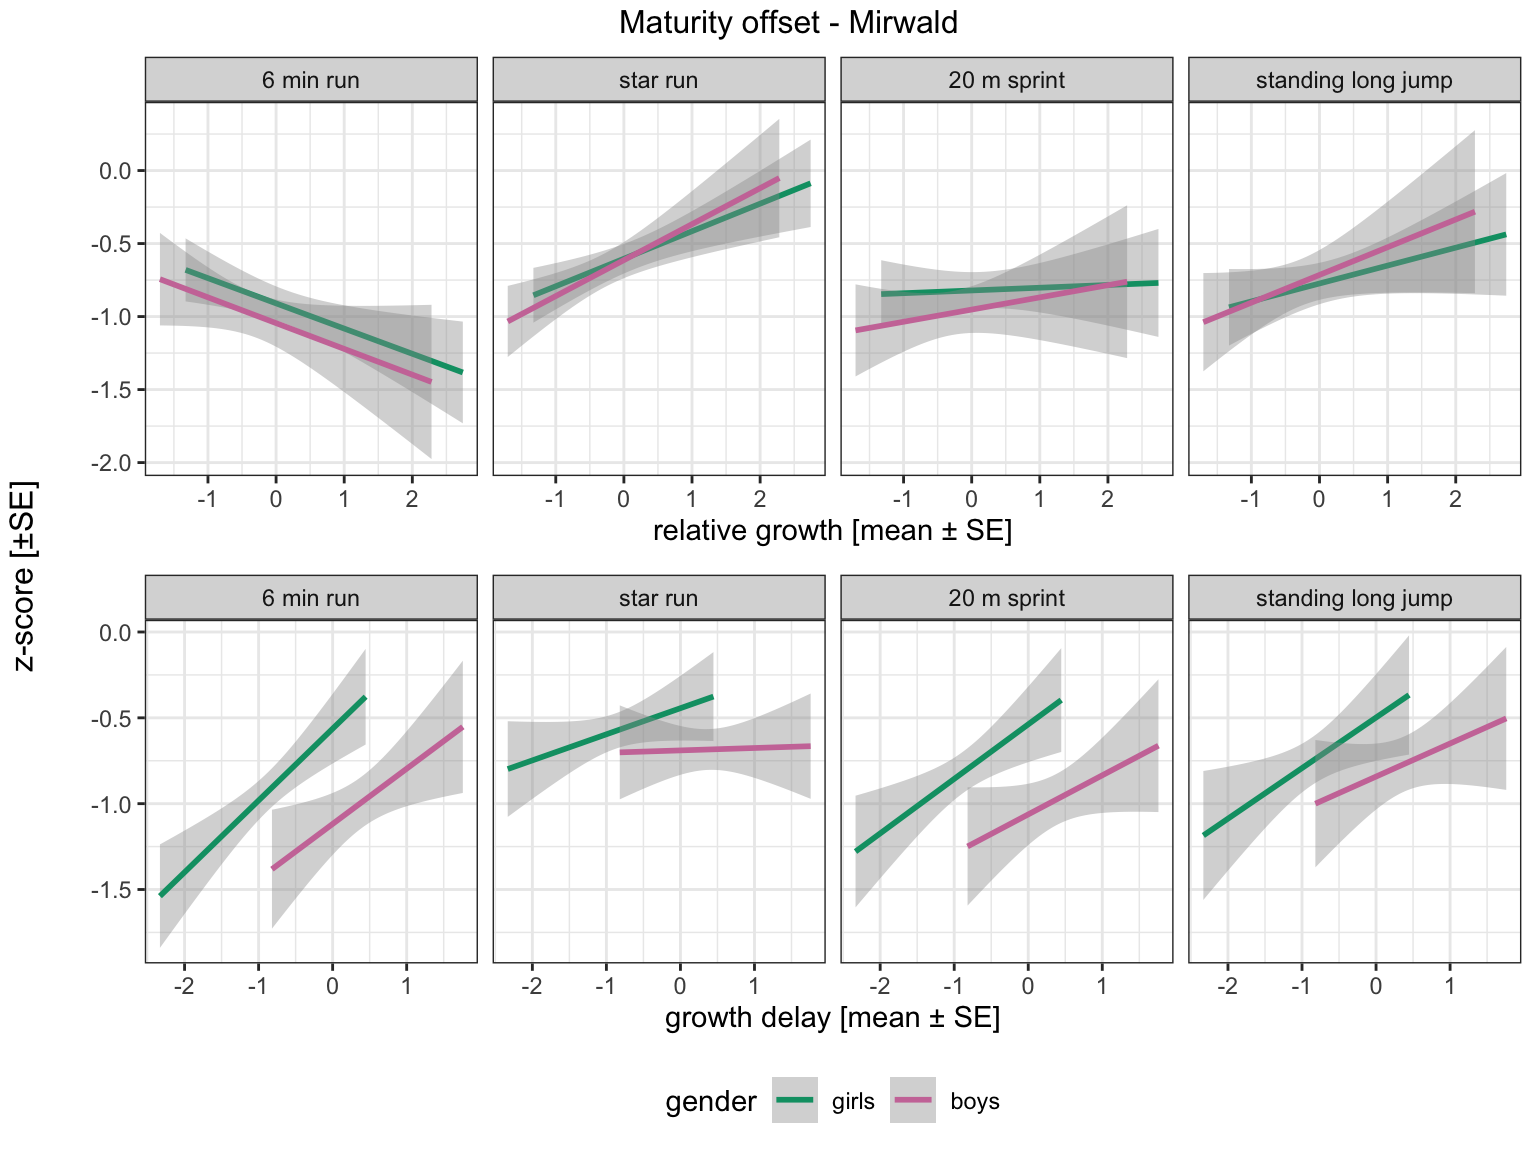
Mirwald, R. L., Baxter-Jones, A. D. G., Bailey, D. A., & Beunen, G. P. (2002). An assessment of maturity from anthropometric measurements.
Medicine and Science in Sports and Exercise,
34, 689–694.
https://doi.org/10.1249/00005768-200204000-00020
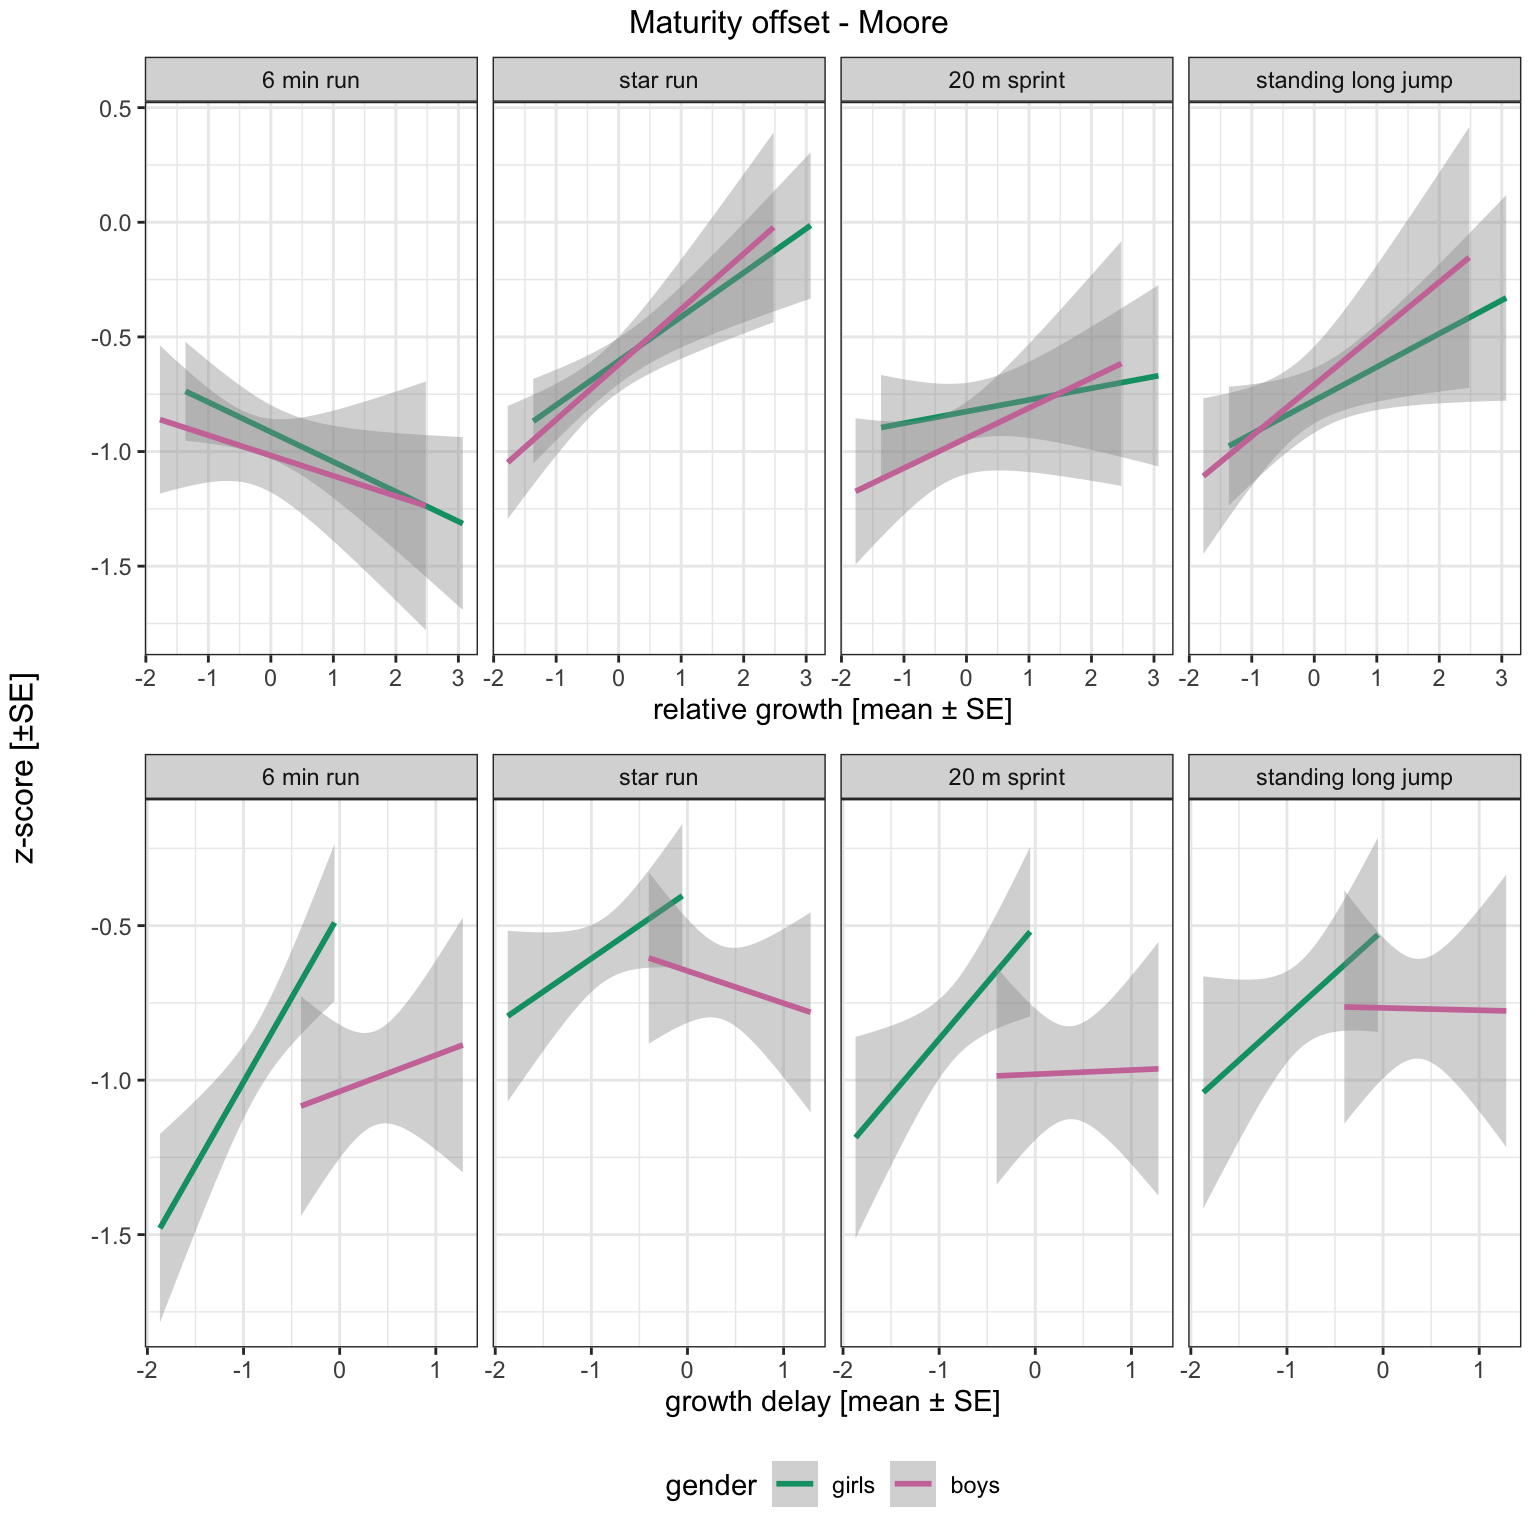
Moore, S. A., McKay, H. A., Macdonald, H., Nettlefold, L., Baxter-Jones, A. D. G., Cameron, N., & Brasher, P. M. A. (2015). Enhancing a somatic maturity prediction model.
Medicine and Science in Sports and Exercise,
47.
https://doi.org/10.1249/MSS.0000000000000588
Niessner, C., Utesch, T., Oriwol, D., Hanssen-Doose, A., Schmidt, S. C. E., Woll, A., Bös, K., & Worth, A. (2020). Representative percentile curves of physical fitness from early childhood to early adulthood: The MoMo study.
Frontiers in Public Health,
8.
https://doi.org/10.3389/fpubh.2020.00458
Oliveira, M. S. R. D., Seabra, A., Freitas, D., Eisenmann, J. C., & Maia, J. (2014). Physical fitness percentile charts for children aged 6-10 from portugal. The Journal of Sports Medicine and Physical Fitness, 54.
Ortega, F. B., Artero, E. G., Ruiz, J. R., España-Romero, V., Jiménez-Pavón, D., Vicente-Rodriguez, G., Moreno, L. A., Manios, Y., Béghin, L., Ottevaere, C., Ciarapica, D., Sarri, K., Dietrich, S., Blair, S. N., Kersting, M., Molnar, D., González-Gross, M., Gutiérrez, Á., Sjöström, M., & Castillo, M. J. (2011). Physical fitness levels among european adolescents: The HELENA study.
British Journal of Sports Medicine,
45.
https://doi.org/10.1136/bjsm.2009.062679
Santos, R., Mota, J., Santos, D. A., Silva, A. M., Baptista, F., & Sardinha, L. B. (2014). Physical fitness percentiles for portuguese children and adolescents aged 10-18 years.
Journal of Sports Sciences,
32.
https://doi.org/10.1080/02640414.2014.906046
Tambalis, K. D., Panagiotakos, D. B., Psarra, G., Daskalakis, S., Kavouras, S. A., Geladas, N., Tokmakidis, S., & Sidossis, L. S. (2016). Physical fitness normative values for 6–18-year-old greek boys and girls, using the empirical distribution and the lambda, mu, and sigma statistical method.
European Journal of Sport Science,
16.
https://doi.org/10.1080/17461391.2015.1088577
Teich, P., Fühner, T., Bähr, F., Puta, C., Granacher, U., & Kliegl, R. (2023). The covid pandemic affected the physical fitness of primary school children. Sports Medicine - Open, 9.
Tomkinson, G. R., Carver, K. D., Atkinson, F., Daniell, N. D., Lewis, L. K., Fitzgerald, J. S., Lang, J. J., & Ortega, F. B. (2018). European normative values for physical fitness in children and adolescents aged 9-17 years: Results from 2 779 165 eurofit performances representing 30 countries.
British Journal of Sports Medicine,
52.
https://doi.org/10.1136/bjsports-2017-098253