4  Analyses of body composition-related effects on physical fitness

Code
suppressWarnings(suppressMessages(library(tidyverse)))
suppressWarnings(suppressMessages(library(ggplot2)))
suppressWarnings(suppressMessages(library(lme4)))
suppressWarnings(suppressMessages(library(sjPlot)))
suppressWarnings(suppressMessages(library(remef)))
suppressWarnings(suppressMessages(library(flextable)))

load(file="data/anthro.rda")
load(file="data/info.rda")
load(file="data/ages.rda")
load(file="data/emo.rda")

cbPalette <- c( "#0072B2", "#D55E00", "#009E73", "#CC79A7",
                "#F0E442", "#56B4E9", "#E69F00", "#999999")

data <- left_join(info, ages) |>
  left_join(anthro) |> 
  left_join(emo, multiple = "all") |> 
  mutate(across(where(is.character), as.factor),
         a1=age-9.9) |> 
  select(Child,Time,a1,Test,zScore,mass,height) |> 
  subset(is.na(zScore)==FALSE)|> 
  arrange(Child, Time) |> 
  fill(mass,height, .direction="downup")

tab_to_flex <- function(tab,x){
tab2 <- tab |> 
  sjtable2df::mtab2df(n_models = 1) |> 
  mutate(p=ifelse(p==Estimates,"",p))
b <- unlist(suppressWarnings(tab2 |> select(p) |> mutate(p = ifelse(p=="<0.001",1,ifelse(as.numeric(p)<0.05,1,0)))))
r <- tab2[1,which(tab2$Predictors=="Random Effects")]
l <- length(b)
flex <- tab2 |> 
  rename(Est.="Estimates",
         SE="std. Error",
         z="Statistic") |> 
  flextable() |> 
  autofit() |> 
  bold(j=5,i=which(b==1))|> 
  bold(j=1,i=r) |> 
  add_footer_row(values = paste0(x,"Est. = estimate; SE = standar error"), colwidths  = 5) |> 
  hline(i = r-1, part = "body") |> 
  width(j=1,width = 4) |> 
  width(j=2:5, width = .5) |>
  fontsize(size=10, part = "all") 
return(flex)
}

4.1 Introduction

The results of the Chapter 3 study show that body mass index (BMI) has a detectable negative effect on physical performances in 6 min run, 20 m sprint, and standing long jump, but not in the star run. However, using BMI as a composite of body height and body mass could potentially mask opposing effects of body height and body mass. Furthermore, including the interaction of both body parameters into the model would allow for a more dynamic understanding of how these parameters interact with the different components of physical fitness. Thus, the main focus of this chapter is on the effects of body height and body mass on physical fitness performance of children with deficits in their physical fitness.

4.2 Statistical analysis and model fitting

For the analysis of body mass and body height effects on physical fitness, 6 min run, 20 m sprint, star run, standing long jump, and ball push test were included in the analysis. As outlined in Section 2.8, ball push test was included in the conceptualisation of physical fitness. This decision was based on the hypothesis that a higher body mass might be beneficial for test performances as body weight could be used as a counterweight. As this hypothesis could not be applied to the one leg balance test, this test was not included in the hypothesis. For details on preprocessing and z-transformation of physical fitness data, see Section 8.1.4, and for anthropological parameters, see Section 8.1.3 of the Appendix. Missing data for body mass and body height were imputed from previous assessments.

A linear mixed models (LMM) analysis approach was implemented, and a parsimonious model selection approach was adopted (Bates et al., 2018). Z-scores of the above mentioned physical fitness tests were used and the physical fitness tests were set as factor levels of Test and successive difference contrasts were applied. Body mass and body height were included as fixed effects nested within the factor levels of Test. Additionally, age was included as a fixed effect. Child was included as a random factor with age as a variance component. Residual-based diagnostics (e.g., q-q plot, standardized residuals over fitted values, etc.) were carried out for the final model and reported in the results.

Code
dat <- data |> 
  subset(Test %in% c("Run", "Star_r", "S20_r", "SLJ", "BPT")) |> 
  mutate(m=mass-40.96,
         m2=m*m,
         h=height-143.51,
         Test=factor(Test, levels = c("Run", "Star_r", "S20_r", "SLJ", "BPT"))) |> 
  select(Child, a1, Test, zScore, m, m2, h)

contrasts(dat$Test)   <- MASS::contr.sdif(5)

The process of model selection is documented in the Appendix Section 8.4.2. The final LMM was fitted with age and Test as fixed factors. Body height and linear and quadratic mass with interactions between height and linear mass were nested within Test. Child was entered as a random factor, including individual age as a variance component.

Code
m3_hm1 <- lmer(zScore ~ 0 + Test/(h * m + m2) + a1 + (1 + a1| Child), data = dat, REML = FALSE, control = lmerControl(calc.derivs = FALSE))

4.3 Results

4.3.1 Fixed effects

LMM showed a significant overall effect for age (β = 14; SE = .06; z = 2.5; p = .013) with performance increasing with age.

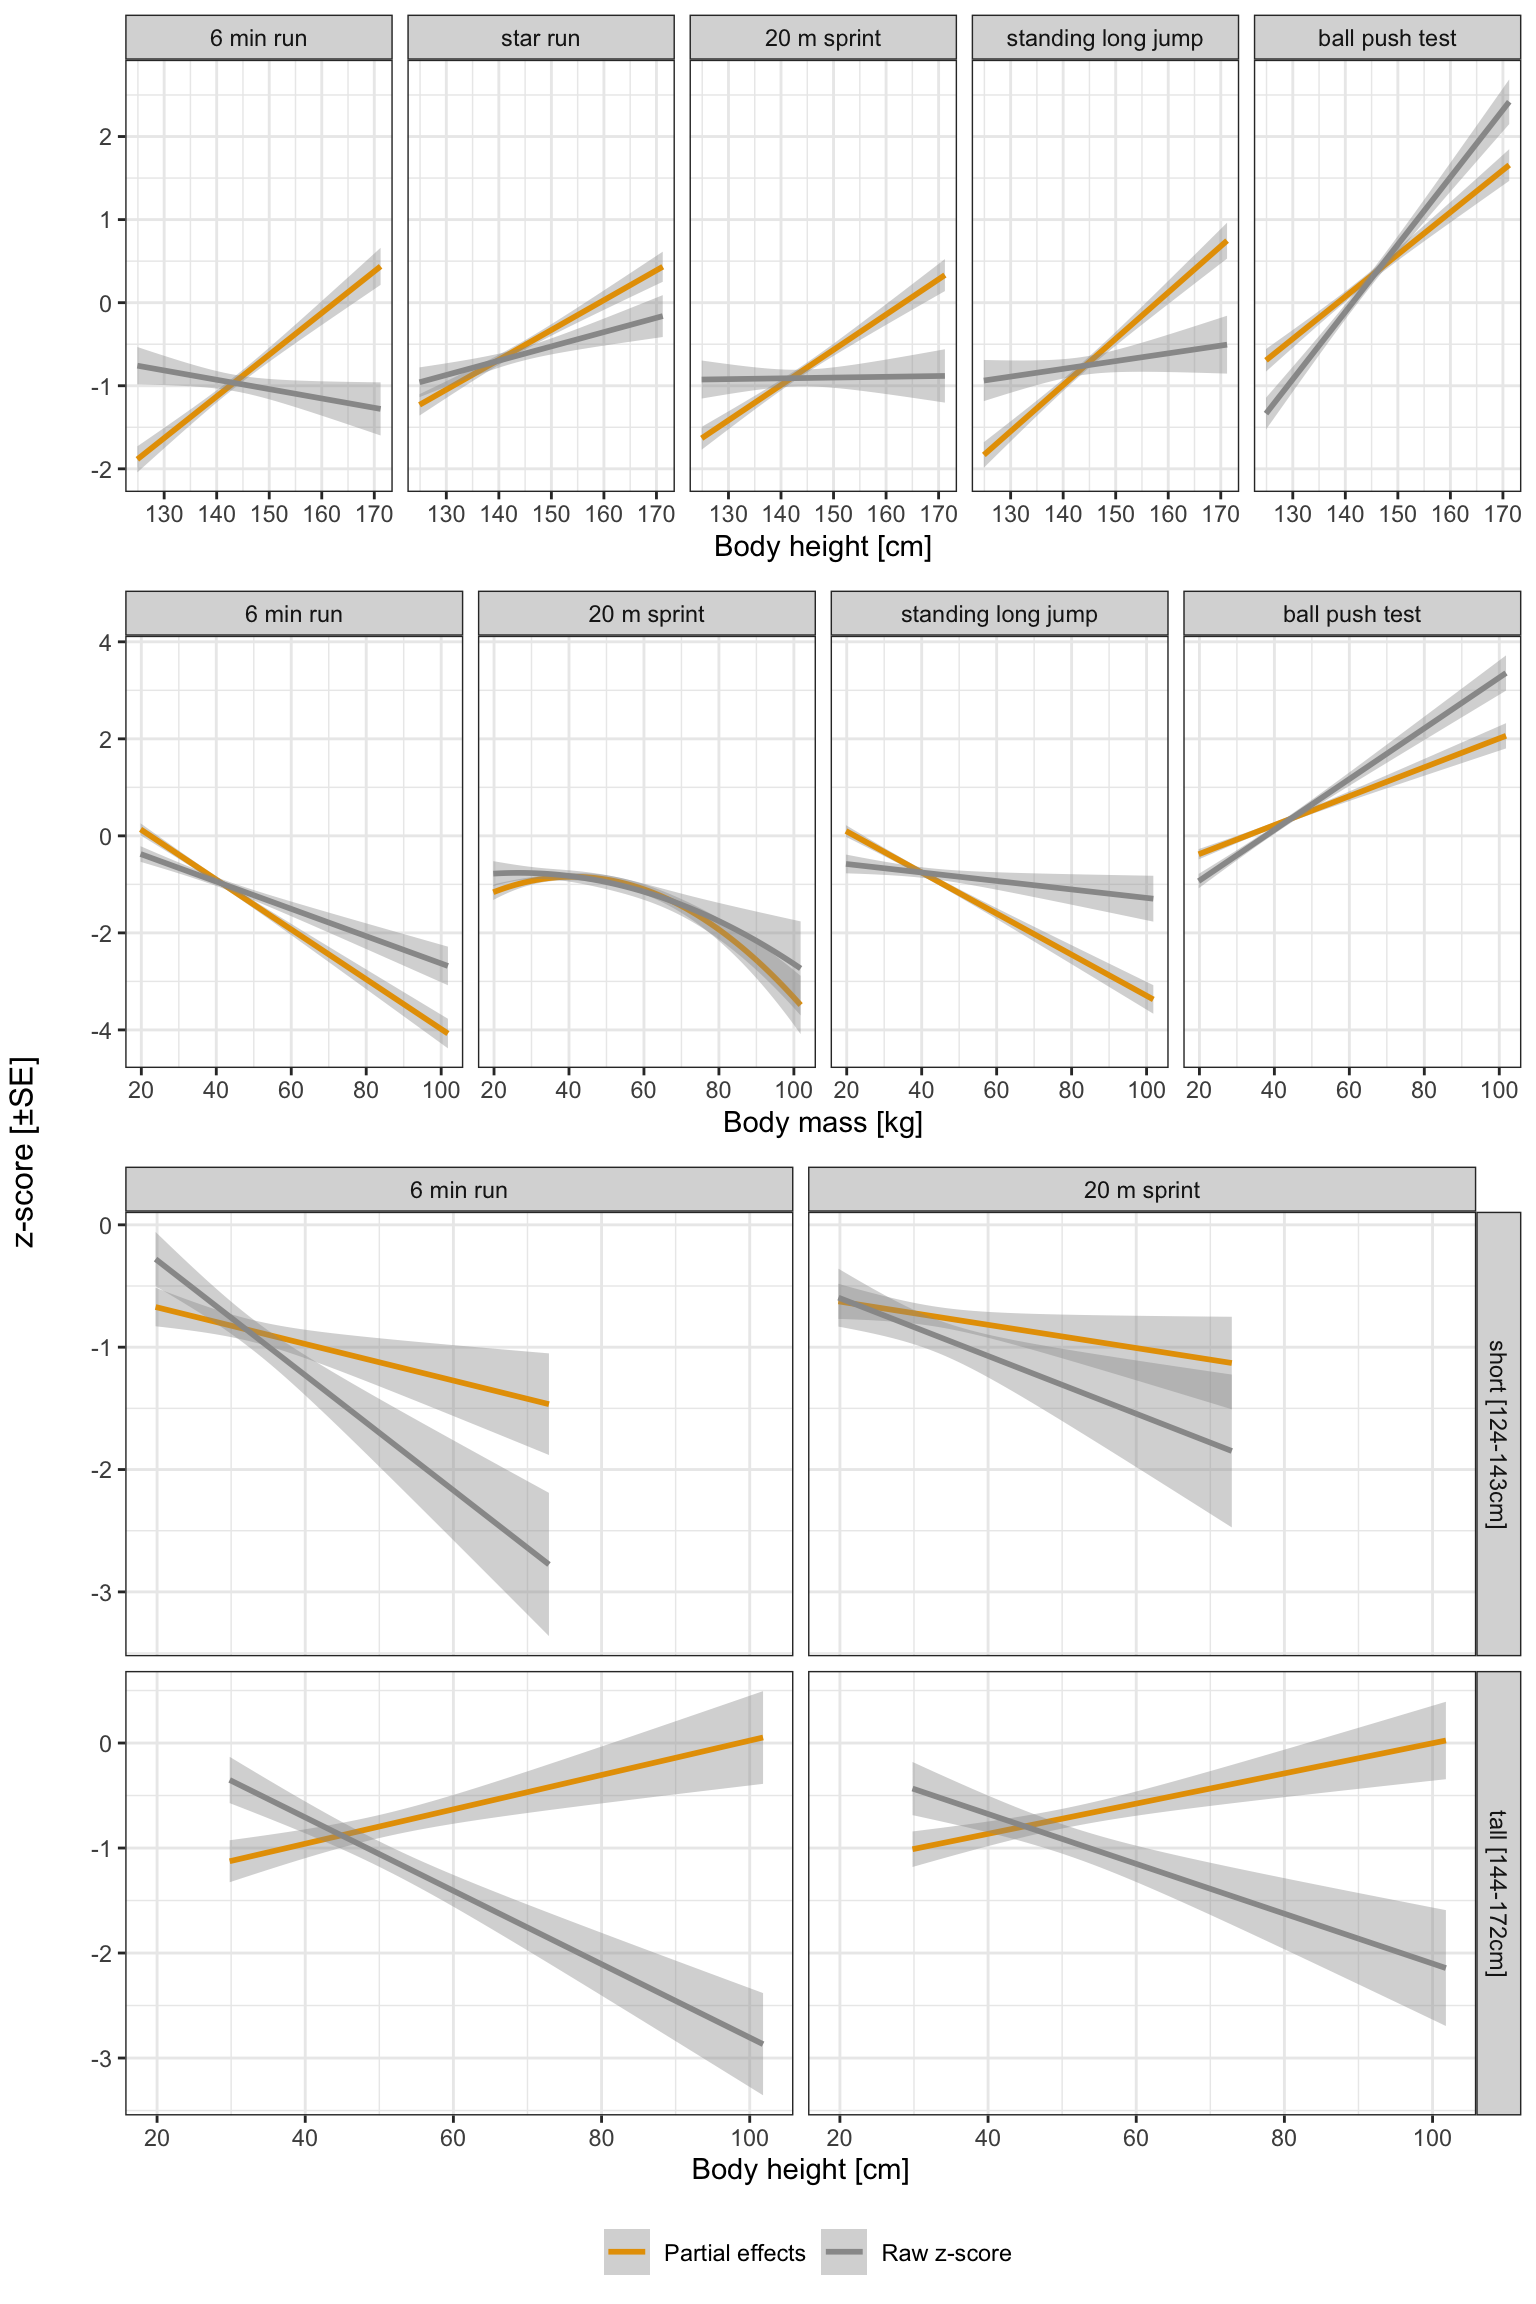
Regarding anthropometric parameters, the LMM revealed better performances for taller children in all included physical fitness tests (i.e., 6 min run (β = .05; SE = .01; z = 4.44; p < .001), star run (β = .04; SE = .01; z = 3.2; p < .001), 20 m sprint (β = .04; SE = .01; z = 3.78; p = .001), standing long jump (β = .06; SE = .01; z = 4.96; p < .001), and ball push test (β = .05; SE = .01; z = 4.53; p < .001).

For body mass, LMM revealed significant negative linear effects for 6 min run (β = -.05; SE = .01; z = -6.61; p < 0.001), and standing long jump (β = -.04; SE = .01; z = -5.48; p < 0.001), with increases in body mass being associated with a decrease in performance. A significant positive linear effect was found for ball push test (β = .03; SE = .01; z = 3.86; p < 0.001), with increases in body mass being associated with increases in ball push distance. The effect of body mass on 20 m sprint performance was characterized by a negative quadratic effect 20 m sprint (β = -.0; SE = .0; z = -2.52; p = .012), indicating that an increase of body mass was first associated with an increase of sprint performance, but then followed by a performance decrease.

For 6 min run (β = .00; SE = .00; z = 2.52; p = .012), and 20 m sprint (β = .00; SE = .00; z =2.30; p = .022), the LMM revealed a significant interaction of body height and body mass. Whereas in smaller children a higher body mass was associated with a lower performance, in taller children a higher body mass was associated with a better performance.

Model results are reported in Table 4.1. The depiction of significant effects is done for raw values as well as partial effects in Figure 4.1. Means and standard deviations of included variables are reported in the Appendix Section 8.4.3.

Code
dat$paref_h  <- keepef(m3_hm1, fix= c(1:5,7:11), ran = NULL)
dat$paref_m  <- keepef(m3_hm1, fix= c(1:5,12:16), ran = NULL)
dat$paref_m2 <- keepef(m3_hm1, fix= c(1:5,17:21), ran = NULL)
dat$paref_hm <- keepef(m3_hm1, fix= c(1:5,22:26), ran = NULL)

p_h <- dat |> 
  mutate(Test=case_when(Test=="Run"~"6 min run",
                        Test=="Star_r"~"star run",
                        Test=="S20_r"~"20 m sprint",
                        Test=="SLJ"~"standing long jump",
                        Test=="BPT"~"ball push test"),
         Test=factor(Test, levels= c("6 min run", "star run", "20 m sprint", "standing long jump","ball push test"))) |> 
  pivot_longer(c(zScore,paref_h)) |> 
  ggplot(aes(x=h+143.51, y=value, colour=name)) +
  geom_smooth(method = "lm") +
  ylab("") +
  xlab("Body height [cm]") +
  facet_grid(.~Test, scales = "free_y") +
  theme_bw() +
  scale_colour_manual(name = "", 
                      labels = c("Partial effects","Raw z-score"),
                      values = c(cbPalette[c(7,8)])) +
  theme(legend.position = "none")

p_m <- dat |> 
  pivot_longer(c(zScore,paref_m)) |> 
  subset(Test %in% c("Run","SLJ","BPT")) |> 
  mutate(value2=NA, paref_m2=NULL) |> 
  rbind(dat |> 
          pivot_longer(c(zScore,paref_m2)) |> 
          subset(Test %in% c("S20_r")) |> 
          mutate(value2=value,
                 value=NA, 
                 paref_m=NULL,
                 name=ifelse(name=="paref_m2","paref_m",name))) |> 
  mutate(Test=case_when(Test=="Run"~"6 min run",
                        Test=="Star_r"~"star run",
                        Test=="S20_r"~"20 m sprint",
                        Test=="SLJ"~"standing long jump",
                        Test=="BPT"~"ball push test"),
         Test=factor(Test, levels= c("6 min run", "star run", "20 m sprint", "standing long jump","ball push test"))) |> 
  ggplot(aes(x=m+40.96, y=value, colour=name)) +
  geom_smooth(method = "lm") +
  geom_smooth(aes(y=value2), method = "lm", formula = y ~ poly(x,2)) +
  ylab("") +
  xlab("Body mass [kg]") +
  facet_grid(.~Test, scales = "free_y") +
  theme_bw() +
  scale_colour_manual(name = "", 
                      labels = c("Partial effects","Raw z-score"),
                      values = c(cbPalette[c(7,8)])) +
  theme(legend.position = "none")

p_hm <- dat |> 
  subset(Test %in% c("Run", "S20_r")) |> 
  mutate(Test=case_when(Test=="Run"~"6 min run",
                        Test=="S20_r"~"20 m sprint"),
         Test=factor(Test, levels= c("6 min run", "20 m sprint"))) |>
  mutate(m_c = ifelse(m<0,"low [16-40kg]","high [41-102kg]"),
         h_c = ifelse(h<0,"short [124-143cm]","tall [144-172cm]")) |> 
  pivot_longer(c(zScore,paref_hm)) |> 
  ggplot(aes(x=m+40.96, y=value, group=interaction(name,h_c), colour=name)) +
  geom_smooth(method = "lm") +
  ylab("") +
  xlab("Body height [cm]") +
  facet_grid(h_c~Test, scales = "free_y") +
  theme_bw() +
  scale_colour_manual(name = "", 
                      labels = c("Partial effects","Raw z-score"),
                      values = c(cbPalette[c(7,8)])) +
  theme(legend.position = "bottom")

gridExtra::grid.arrange(p_h, p_m, p_hm, nrow = 3, heights=c(1,1,2), left = "z-score [±SE]")
Figure 4.1: Effects of body height, body mass, and the interaction of body height and body mass on physical fitness z-scores and partial effects; SE = standard error
Code
tab5 <- tab_model(m3_hm1, digits=2, digits.re=2, show.se=TRUE, show.stat=TRUE, show.ci=FALSE,CSS = css_theme("cells"),
                  pred.labels = c("Test [Run]", "Test [Star_r]", "Test [S20_r]", "Test [SLJ]", "Test [BPT]", "a1", "Test [Run] : h", "Test [Star_r] : h", "Test [S20_r] : h", "Test [SLJ] : h", "Test [BPT] : h", "Test [Run] : m", "Test [Star_r] : m", "Test [S20_r] : m", "Test [SLJ] : m", "Test [BPT] : m", "Test [Run] : m2", "Test [Star_r] : m2", "Test [S20_r] : m2", "Test [SLJ] : m2", "Test [BPT] : m2", "Test [Run] : h * m", "Test [Star_r] : h * m", "Test [S20_r] : h * m", "Test [SLJ] : h * m", "Test [BPT] : h * m"))

tab_to_flex(tab5, "Run = 6 min run, Star_r = star run, S20_r = 20 m sprint, SLJ = standing long jump, BPT = ball push test, a1 = zero centered age, h = linear zero centered body height, m = linear zero centered body mass, m2 = quadratic zero centered body mass")
Table 4.1: Effects of body height and body mass on physical performance

Predictors

Est.

SE

z

p

Test [Run]

-0.95

0.08

-11.54

<0.001

Test [Star_r]

-0.56

0.08

-6.81

<0.001

Test [S20_r]

-0.84

0.08

-10.22

<0.001

Test [SLJ]

-0.80

0.08

-9.66

<0.001

Test [BPT]

0.25

0.08

3.05

0.002

a1

0.14

0.06

2.50

0.013

Test [Run] : h

0.05

0.01

4.44

<0.001

Test [Star_r] : h

0.04

0.01

3.20

0.001

Test [S20_r] : h

0.04

0.01

3.78

<0.001

Test [SLJ] : h

0.06

0.01

4.96

<0.001

Test [BPT] : h

0.05

0.01

4.53

<0.001

Test [Run] : m

-0.05

0.01

-6.61

<0.001

Test [Star_r] : m

-0.01

0.01

-1.58

0.114

Test [S20_r] : m

-0.03

0.01

-4.12

<0.001

Test [SLJ] : m

-0.04

0.01

-5.48

<0.001

Test [BPT] : m

0.03

0.01

3.86

<0.001

Test [Run] : m2

-0.00

0.00

-1.91

0.056

Test [Star_r] : m2

-0.00

0.00

-1.57

0.117

Test [S20_r] : m2

-0.00

0.00

-2.52

0.012

Test [SLJ] : m2

0.00

0.00

1.36

0.174

Test [BPT] : m2

-0.00

0.00

-0.76

0.446

Test [Run] : h * m

0.00

0.00

2.52

0.012

Test [Star_r] : h * m

0.00

0.00

0.92

0.356

Test [S20_r] : h * m

0.00

0.00

2.30

0.022

Test [SLJ] : h * m

-0.00

0.00

-0.41

0.680

Test [BPT] : h * m

-0.00

0.00

-0.23

0.819

Random Effects

σ2

0.38

τ00Child

0.35

τ11Child.a1

0.02

ρ01Child

0.57

ICC

0.49

N Child

76

Observations

1771

Marginal R2 / Conditional R2

0.396 / 0.690

Run = 6 min run, Star_r = star run, S20_r = 20 m sprint, SLJ = standing long jump, BPT = ball push test, a1 = zero centered age, h = linear zero centered body height, m = linear zero centered body mass, m2 = quadratic zero centered body massEst. = estimate; SE = standar error

4.3.2 Variance components and correlation parameters

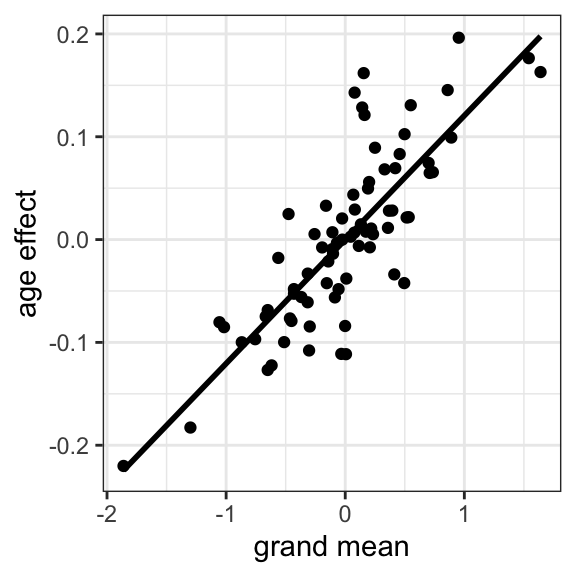
The random effect structure revealed differences between children in age effects on physical fitness. The child-related grand mean positively correlated with age effects (r = .57), meaning that fitter children were more likely to show greater age-related improvements. Individual variance components and correlation parameters are reported in Table 4.2, and the correlation between grand mean and age-related effects is plotted in Figure 4.2.

Code
ranef(m3_hm1)$Child |> 
  data.frame() |> 
  ggplot(aes(x=X.Intercept., y=a1)) +
  geom_point()+
  geom_smooth(method = "lm", colour = "black", se=F) +
  ylab("age effect") +
  xlab("grand mean") +
  theme_bw() 
Figure 4.2: Correlation of children’s grand mean and age effects
Code
vc <- VarCorr(m3_hm1)

as.data.frame(vc, order="lower.tri") |> 
  filter(is.na(var2)==T) |> 
  select(-var2) |> 
  left_join(as.data.frame(vc, order="lower.tri") |> 
              select(-vcov) |> 
              pivot_wider(names_from = var2, values_from = sdcor) |> 
              select(-c(grp,var1,`NA`)) |> 
              filter_all(any_vars(!is.na(.))) |> 
              t() |> 
              as.data.frame() |> 
              rownames_to_column(var="var1")) |> 
  mutate(across(where(is.numeric), \(x) round(x, 3)),
         var1=ifelse(var1=="(Intercept)","grand mean",var1)) |> 
  rename("Groups"=grp, "Name"=var1, "Variance"=vcov, "SD"=sdcor, "Corr"=V1) |> 
  flextable() |> 
  autofit() |> 
  add_footer_row(values="a1 = age centered at 0", colwidths = 5) |> 
  set_header_labels(V2 = "", V3 = "", V4 = "")
Table 4.2: Variance components and correlation parameter of ‘m3_hm1’

Groups

Name

Variance

SD

Corr

Child

grand mean

0.345

0.588

Child

a1

0.016

0.127

0.573

Residual

0.378

0.615

a1 = age centered at 0

4.3.3 Model diagnostics

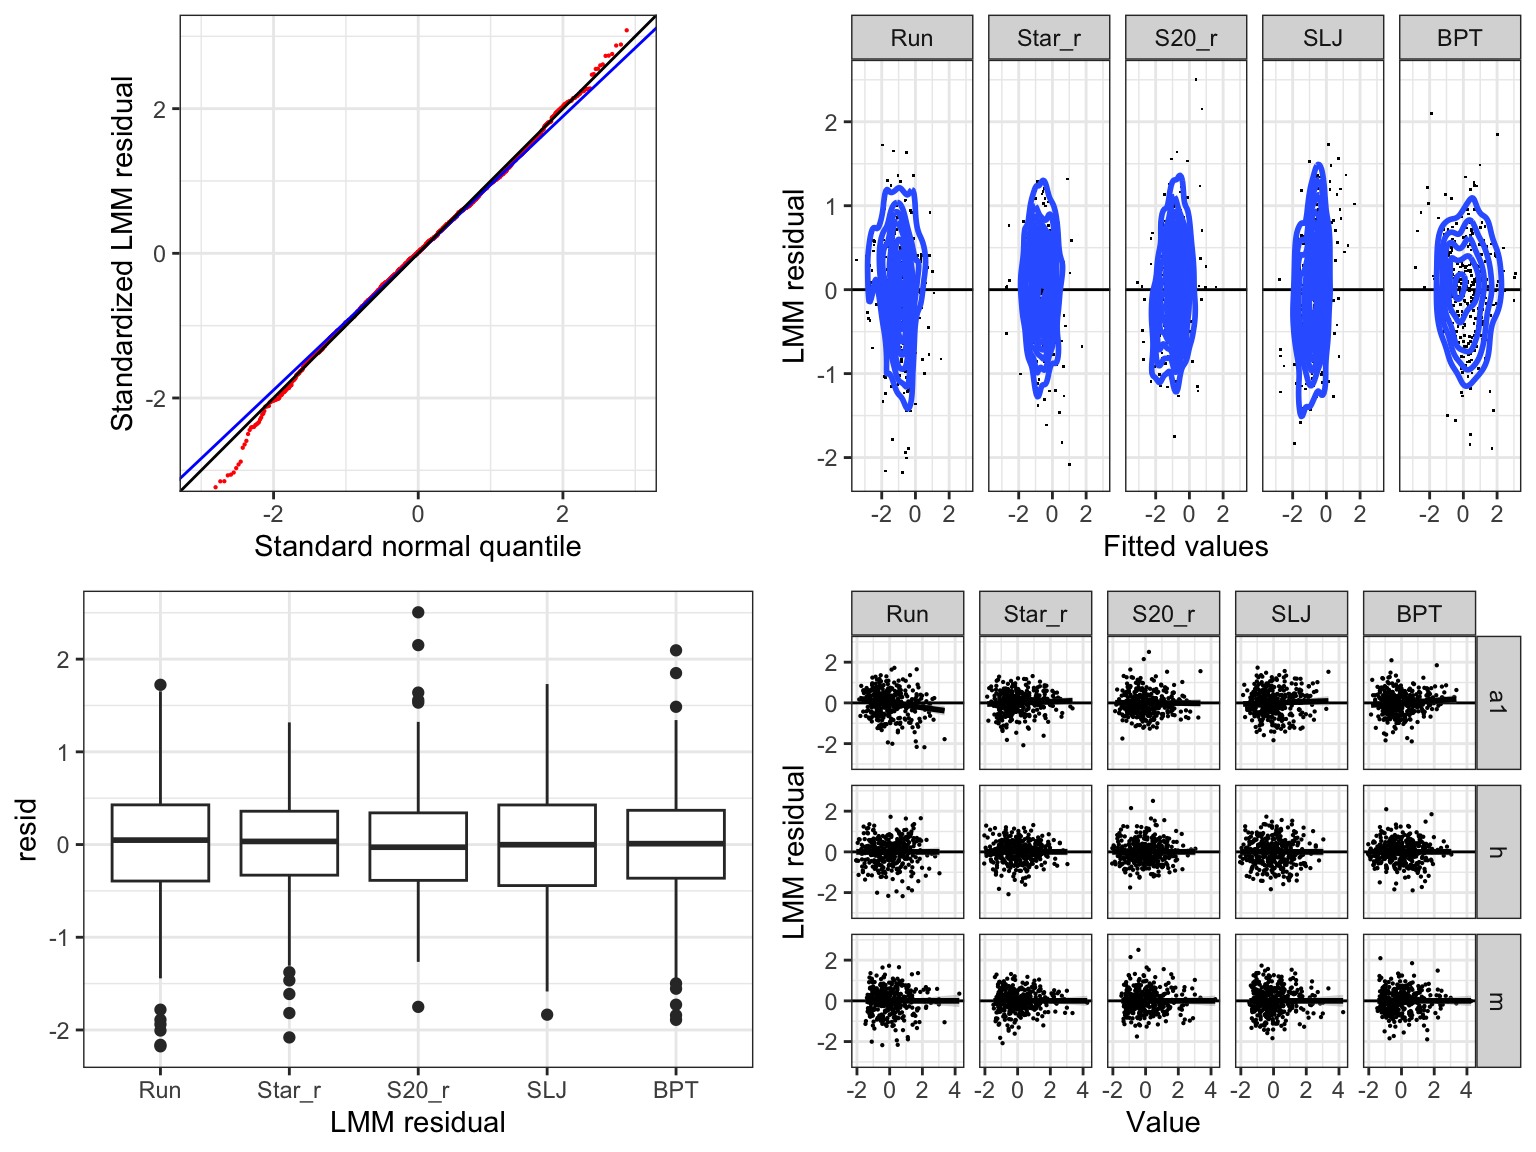
Model performance parameters did not reveal any violations of LMM requirements and are plotted in Figure 4.3.

Code
dat$resid  <- resid(m3_hm1)
dat$sresid <- resid(m3_hm1)/sd(resid(m3_hm1))
dat$fitted <- fitted(m3_hm1)

p_qq <- dat %>% 
   ggplot(aes(sample = sresid)) + 
   stat_qq(size=.1, color="red") +
   stat_qq_line(color="blue") +
   geom_abline(intercept=0,slope=1) + 
   xlab("Standard normal quantile") + 
   ylab("Standardized LMM residual") + 
   coord_fixed(ratio=1, xlim = c(-3,+3), ylim=c(-3,3)) + theme_bw()

p_f <- dat %>%  
  ggplot(aes(x=fitted, y=resid)) +   
  facet_grid(.~Test) +
  geom_point(shape=I(".")) +  
  xlab("Fitted values") + ylab("LMM residual") + theme_bw() +
  geom_hline(yintercept=0)  +  geom_density2d(linewidth=1) 

p_box <- dat |> 
  ggplot(aes(resid, Test)) + 
  geom_boxplot() +
  ylab("LMM residual") +
  coord_flip() + theme_bw()

p_at <- dat |>  
  mutate(a1=scale(a1),h=scale(h),m=scale(m)) |> 
  pivot_longer(c(a1,m,h)) |> 
  ggplot(aes(value, resid)) + 
  geom_point(colour="black", size=.1) + 
  geom_hline(yintercept=0) + 
  geom_smooth(method="lm", color="black") + 
  facet_grid(name~Test) +
  ylab("LMM residual") + xlab("Value") +theme_bw() +
  coord_cartesian(ylim=c(-3,+3)) 

gridExtra::grid.arrange(p_qq, p_f, p_box, p_at)  
Figure 4.3: Model performance parameters

4.4 Summary of results

This LMM revealed that (1) physical performance increased with body height in all tests used, (2) negative linear effects of body mass were found for performances in 6 min run and standing long jump, with children with higher body mass showing lower test performances, (3) a negative quadratic trend was found for 20 m sprint performances, with stronger negative effects occurring with increasing body mass, (4) a positive effect was found of body mass on ball push test performances, with improvements in performances in children with higher levels of body mass, and (5) significant interactions between body height and body mass on 6 min run and 20 m sprint performances, with higher levels of body mass being associated with performance improvements in taller children, while in shorter children increases in body mass were associated with decreases in performance. Additionally, the LMM revealed (6) general age-related improvements in all tests of physical fitness, and (7) a positive correlation of individual variance components between overall physical fitness and age, with fitter children more likely to show greater age-related improvements.

4.5 Discussion

Similar trends for body height and body mass were found in studies that used allometric modelling to assess effects of body height and body mass on 20 m shuttle run, 12 min run, cooper test, 40 m sprint, 10 x 5 m shuttle run, vertical jump, standing long jump performances, and handgrip strength. The approach yielded predominantly positive associations for body height and negative associations for body mass with test performances, with the only exception being handgrip strength, where a positive association was found between body mass and test performances1 (Giuriato et al., 2020; Lovecchio et al., 2019; Nevill et al., 2009; Silva et al., 2016; Valdivia et al., 2015). As argued in these studies, positive effects found in this chapter of body height on standing long jump, 6 min run, 20 m sprint, and star run performances can be attributed to physical advantages associated with an elevated center of gravity, longer legs, and slender stature (Giuriato et al., 2020; Lovecchio et al., 2019; Santos et al., 2018; Silva et al., 2016; Valdivia et al., 2015). Negative effects of body mass on standing long jump, 6 min run, and 20 m sprint performances can be attributed to excess body mass associated with body fat (Norman et al., 2005). In fact, introducing body fat percent into allometric analyses of the association of body height and mass with standing long jump, a negative association with standing long jump performance was found for body fat percent and a positive association for body mass (Lovecchio et al., 2019). Of note, indications of a negative effect were also found for body mass on star run performances (β = -.01; SE = .01; z = -1.58; p = .114; see Table 4.1). This trend was not significant in the present sample, but may reach significance in higher-powered studies with larger samples, especially as body mass has been shown to be negatively associated with gross motor coordination performances2 (Santos et al., 2018). For ball push test performance, effects of body height and mass are similar to those reported for handgrip strength (Nevill et al., 2009; Silva et al., 2016; Valdivia et al., 2015). Results are consistent with the hypothesis that fitness tests that do not utilise total body mass benefit from increased muscle mass without being affected by fat mass (Deforche et al., 2003; Ervin et al., 2014). Furthermore, it has been theorised that in addition to more efficient use of muscle mass, body mass can act as leverage or counterweight to further increase strength performance, resulting in greater than expected improvements in the respective muscular strength tests (Asmussen & Heebøll-Nielsen, 1955; Nevill et al., 2009).

In addition, the LMM showed significant interactions between body height and body mass affecting performances in 6 min run and 20 m sprint. Here, taller children exhibit a positive relationship between body mass and test performances, while smaller children’s performances decreased with increasing body mass. When interpreting these results, it should be taken into account that body mass in children increases with height by a power of approximately two during growth (Chung, 2015). Another study found that fat-free mass in children scales with height by a power of about three, while fat mass does not appear to scale with height (Wang et al., 2012). This would suggest that body mass gains in larger children might be more skewed towards fat-free mass, while in smaller children the same absolute body mass gains would be more skewed towards fat mass. As there seems to be a positive correlation between fat-free mass and cardiorespiratory and muscular fitness, and a negative correlation for fat mass (Joensuu et al., 2018), this could explain the interaction found between body height and mass. That is, in larger children, mass gain is more likely to be associated with an increase in fat-free mass, which increases performances in 6 min run and 20 m sprint, while in smaller children, the same absolute mass gains are more likely to be associated with fat mass, which adversely affects performances in these tests. However, given scalings of body mass parameters with height cited above, it would be interesting to examine how interactions between different body size parameters relate to physical fitness test performances. More specifically, deconstructing the widely used BMI into its subcomponents and their interactions and assessing the relevance of these subcomponents and interactions for different components of physical fitness.

Aside anthropometric variables, age was included as a fixed effect and a variance component in the individual random effects. Including age in the fixed effects revealed overall expected age-related improvements in all test performances (Albrecht, 2015; Niessner et al., 2021; Ortega et al., 2023). Interestingly, including age as a variance component in the individual random factors revealed a significant correlation between overall physical fitness (i.e., grand mean) and age-related improvements, with fitter children being more likely to show greater age-related increases in physical fitness. Comparable results were found in analyses of the EMOTIKON study, where age of children was included as a variance component in the random effect structure of schools. Analysis of physical fitness of 108,295 third graders aged 8 to 8.99 years showed a positive correlation (r = .48) between grand mean and age-related effects at school level (Fühner et al., 2021). These results were replicated in the covid pandemic effects analysis in 83,476 third graders aged 8.05 to 9.11 years (r = .49) in the EMOTIKON sample (Teich et al., 2023). The authors argue that either schools that offer more fitness-promoting resources could produce greater gains in children’s physical fitness, or fitter children could have greater fitness gains in a year, leading to greater overall school-related fitness as well as greater age-related fitness improvements (Fühner et al., 2021). The present study shows that the correlation is replicable at the individual level and in a smaller sample, and might therefore also exist within schools. It remains unclear whether this is driven by children using resources at their schools to promote fitness, or by children with greater age-related improvements showing a steeper trajectory of physical fitness over their lifetime, leading to higher levels of physical fitness when assessed within a specific time period. However, the correlations could also be indicative of socioeconomic dependencies of schools and children’s families. Quality of schools is related to its areas socioeconomic status (Nieuwenhuis & Xu, 2021), meaning that “better” schools tend to be located in more affluent neighbourhoods, and that differences in within-school performance are related to the socioeconomic background of children’s families (Ma, 2000). This might suggest that the correlation between overall physical fitness and age-related improvement in physical fitness, both at school and individual level, might be at least partly due to different opportunities available to each child depending on the socioeconomic background of the area and their family (Rittsteiger et al., 2021).

4.6 Implications and subsequent analyses

Considering the overall positive effects of body height as well as age on physical fitness performances, the question remains whether these effects are associated with growth and maturation of the included children. Further, regarding the positive correlation between the overall level of physical fitness and the magnitude of age effects on an individual level, it remains unclear how these effects are moderated. Accordingly, the following Chapter 5 will assess the effects of age and the maturity offset estimated using two different formulas (Mirwald et al., 2002; Moore et al., 2015) on physical fitness. Of note, as the ball push test might be differently associated with changes in physical fitness associated with growth and age, it was not included in the following analysis to allow a more precise modeling of the effects of age and maturity offset and a latent construct of physical fitness (Fühner et al., 2021). Additionally, age and maturity offset will also be considered on an individual level to analyse whether the positive correlation between age-related effects and overall physical fitness is caused/moderated by more mature children.


  1. Analyses were conducted with. (1) 672 Greek schoolchildren (boys: n = 348, age 12.2 ± 0.7 years; girls: n = 324, age 12.2 ± 0.5 years) on 20 m shuttle run, 40 m sprint, vertical jump, and handgrip strength tests, with linear and quadratic trends for age also included in the models (Nevill et al., 2009), (2) 1,995 girls and 1,669 boys aged 11 to 17 from three areas in central Peru on 12 min run, standing long jump, grip strength, curl-up, and 10 x 5 m pendulum run tests, with maturity offset also included in the models (Valdivia et al., 2015), (3) 2,385 girls and 2,175 boys aged 9-15 from Peru and Brazil in 12 min run, standing long jump, grip strength, and 10 x 5 m pendulum run tests, with a maturity offset and physical activity also included in the models (Silva et al., 2016), (4) 3,058 boys and 4,044 girls aged 11-14 years living in an urban or rural area in northern Italy in sit-up and standing long jump (Lovecchio et al., 2019), and (5) 556 European sedentary children aged 11-13 years (282 boys; 274 girls) using the Cooper test (Giuriato et al., 2020).↩︎

  2. Gross motor coordination was assessed in 245 children (122 girls) aged 6 to 9 years from the Azores Islands using the ‘Körperkoordinationstest für Kinder’, which consisted of a balance task, successive lateral jumps, hopping on one leg over an obstacle and moving platforms (Schilling & Kiphard, 1974).↩︎